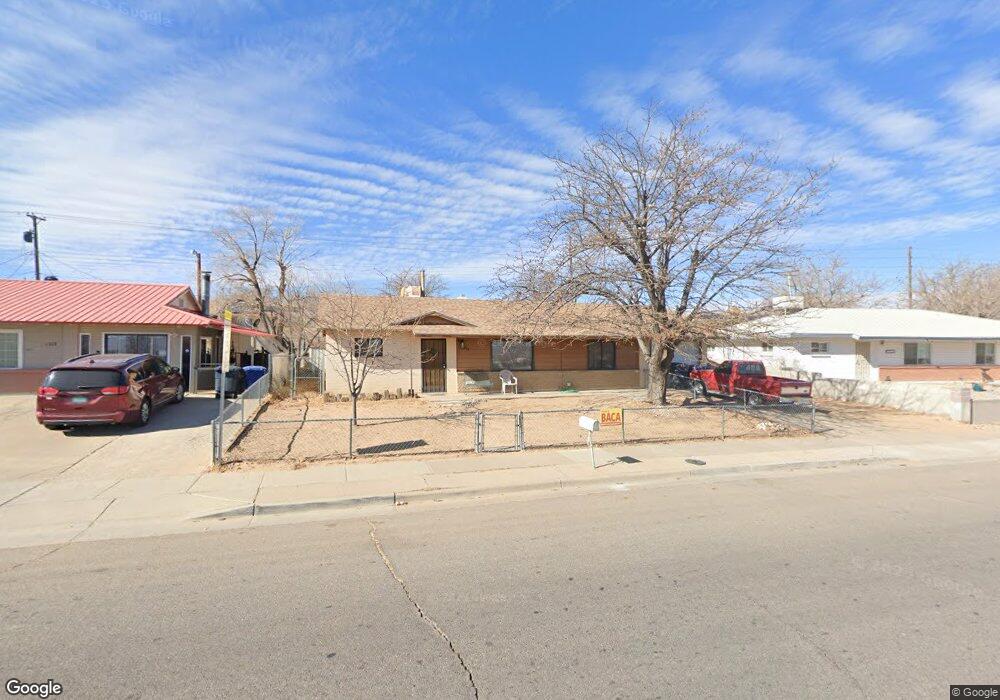
1317 Delgado Dr SW Albuquerque, NM 87121
Southwest Heights NeighborhoodEstimated Value: $231,000 - $246,000
4
Beds
2
Baths
1,338
Sq Ft
$177/Sq Ft
Est. Value
About This Home
This home is located at 1317 Delgado Dr SW, Albuquerque, NM 87121 and is currently estimated at $236,281, approximately $176 per square foot. 1317 Delgado Dr SW is a home located in Bernalillo County with nearby schools including Carlos Rey Elementary School, Tony Hillerman Middle School, and Atrisco Heritage Academy High School.
Ownership History
Date
Name
Owned For
Owner Type
Purchase Details
Closed on
Mar 5, 2008
Sold by
Triana Bernadette D
Bought by
Baca Frank Alfonso and Baca Cynthia Ann
Current Estimated Value
Home Financials for this Owner
Home Financials are based on the most recent Mortgage that was taken out on this home.
Original Mortgage
$93,650
Interest Rate
6.3%
Mortgage Type
Seller Take Back
Purchase Details
Closed on
Sep 10, 2005
Sold by
Brown James B and Brown Maria O
Bought by
Triana Bernadette D
Home Financials for this Owner
Home Financials are based on the most recent Mortgage that was taken out on this home.
Original Mortgage
$96,485
Interest Rate
5.8%
Mortgage Type
FHA
Purchase Details
Closed on
Jun 26, 1998
Sold by
Jackson Judith H
Bought by
Brown James B and Brown Maria O
Home Financials for this Owner
Home Financials are based on the most recent Mortgage that was taken out on this home.
Original Mortgage
$76,600
Interest Rate
7.21%
Mortgage Type
VA
Create a Home Valuation Report for This Property
The Home Valuation Report is an in-depth analysis detailing your home's value as well as a comparison with similar homes in the area
Home Values in the Area
Average Home Value in this Area
Purchase History
| Date | Buyer | Sale Price | Title Company |
|---|---|---|---|
| Baca Frank Alfonso | -- | Fidelity Natl Title Ins Co | |
| Baca Frank Alfonso | $99,900 | Fidelity Natl Title Ins Co | |
| Triana Bernadette D | -- | Stewart Title | |
| Brown James B | -- | Fidelity National Title |
Source: Public Records
Mortgage History
| Date | Status | Borrower | Loan Amount |
|---|---|---|---|
| Previous Owner | Baca Frank Alfonso | $93,650 | |
| Previous Owner | Triana Bernadette D | $96,485 | |
| Previous Owner | Brown James B | $76,600 |
Source: Public Records
Tax History Compared to Growth
Tax History
| Year | Tax Paid | Tax Assessment Tax Assessment Total Assessment is a certain percentage of the fair market value that is determined by local assessors to be the total taxable value of land and additions on the property. | Land | Improvement |
|---|---|---|---|---|
| 2024 | $1,365 | $32,352 | $9,871 | $22,481 |
| 2023 | $1,342 | $31,410 | $9,583 | $21,827 |
| 2022 | $1,297 | $30,495 | $9,304 | $21,191 |
| 2021 | $1,254 | $29,607 | $9,033 | $20,574 |
| 2020 | $1,233 | $28,745 | $8,770 | $19,975 |
| 2019 | $1,197 | $27,909 | $8,515 | $19,394 |
| 2018 | $1,154 | $27,909 | $8,515 | $19,394 |
| 2017 | $1,119 | $27,096 | $8,267 | $18,829 |
| 2016 | $1,087 | $25,542 | $7,793 | $17,749 |
| 2015 | $24,798 | $24,798 | $7,566 | $17,232 |
| 2014 | $1,063 | $25,031 | $7,566 | $17,465 |
| 2013 | -- | $25,031 | $7,566 | $17,465 |
Source: Public Records
Map
Nearby Homes
- 1309 Canyon Trail SW
- 10709 Anaya St SW
- 10622 Benavides Rd SW
- 1401 Elfego Baca Dr SW
- 1111 Carla St SW
- 1520 Elfego Baca Dr SW Unit 2
- 10312 Cornelia Ct SW
- 11105 Pecos Place SW
- 11004 Teal Rd SW
- 10216 Teal Rd SW
- 919 Crane Dr SW
- 10409 Red Robin Rd SW
- 10316 Andalusian Ave SW
- 10915 Denton Rd SW
- 11001 Paso Fino Ave SW
- 10427 Sandy Flats Ave SW
- 10504 Connemara Dr SW
- 2204 San Leon St SW
- 2105 Hermosa Creek Dr SW
- 1327 Amole Vista St SW
- 1319 Delgado Dr SW
- 1315 Delgado Dr SW
- 1321 Delgado Dr SW
- 1318 Canyon Trail SW
- 1318 Canyon Trail SW Unit 1
- 1320 Canyon Trail SW
- 1314 Canyon Trail SW
- 1313 Delgado Dr SW
- 1322 Canyon Trail SW
- 1312 Canyon Trail SW
- 1323 Delgado Dr SW
- 1324 Canyon Trail SW
- 1309 Delgado Dr SW
- 1310 Canyon Trail SW
- 1317 Canyon Trail SW
- 1315 Canyon Trail SW
- 1319 Canyon Trail SW
- 1313 Canyon Trail SW
- 1308 Canyon Trail SW
- 1321 Canyon Trail SW