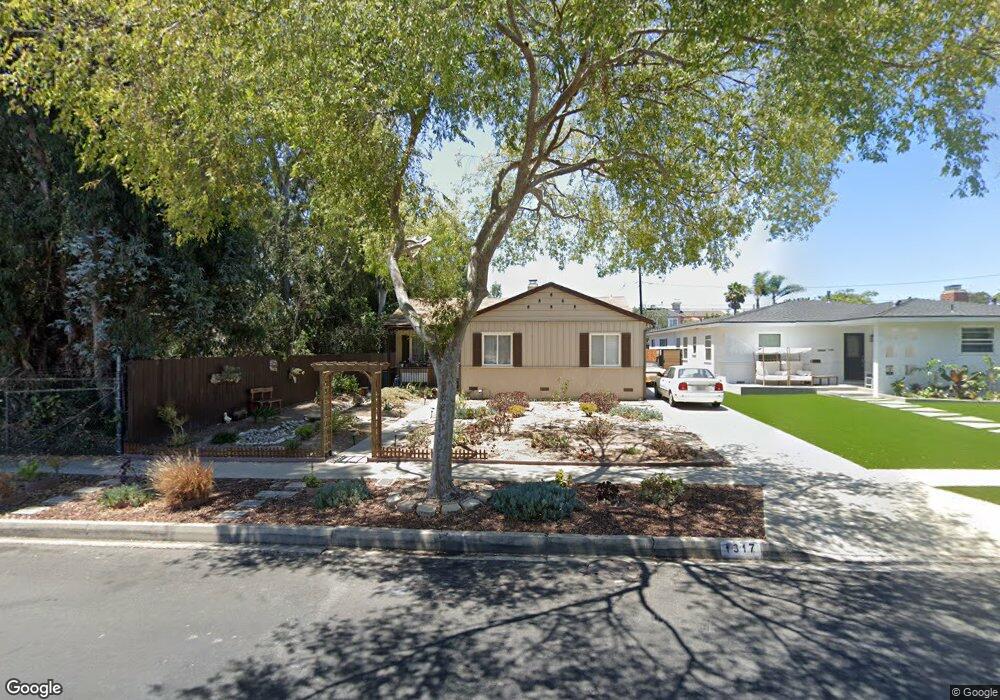
1317 Maple Ave Torrance, CA 90503
Central Torrance NeighborhoodEstimated Value: $1,138,128 - $1,152,000
3
Beds
1
Bath
1,086
Sq Ft
$1,054/Sq Ft
Est. Value
About This Home
This home is located at 1317 Maple Ave, Torrance, CA 90503 and is currently estimated at $1,144,782, approximately $1,054 per square foot. 1317 Maple Ave is a home located in Los Angeles County with nearby schools including Hickory Elementary School, Madrona Middle School, and Torrance High School.
Ownership History
Date
Name
Owned For
Owner Type
Purchase Details
Closed on
Oct 23, 2014
Sold by
Mackay Gareth P
Bought by
Bakardjiev Dimitar and Bakardzhieva Anna
Current Estimated Value
Home Financials for this Owner
Home Financials are based on the most recent Mortgage that was taken out on this home.
Original Mortgage
$58,410
Outstanding Balance
$44,562
Interest Rate
3.89%
Mortgage Type
Credit Line Revolving
Estimated Equity
$1,100,220
Purchase Details
Closed on
Mar 28, 2008
Sold by
The Doris M Routh Living Trust
Bought by
Mackay Gareth P
Home Financials for this Owner
Home Financials are based on the most recent Mortgage that was taken out on this home.
Original Mortgage
$535,158
Interest Rate
6.11%
Mortgage Type
FHA
Purchase Details
Closed on
Nov 29, 1997
Sold by
Routh Doris M
Bought by
Routh Doris M and The Doris M Routh Living Trust
Create a Home Valuation Report for This Property
The Home Valuation Report is an in-depth analysis detailing your home's value as well as a comparison with similar homes in the area
Home Values in the Area
Average Home Value in this Area
Purchase History
| Date | Buyer | Sale Price | Title Company |
|---|---|---|---|
| Bakardjiev Dimitar | $590,000 | Equity Title Co | |
| Mackay Gareth P | $555,000 | Lawyers Title | |
| Routh Doris M | -- | -- | |
| Routh Doris M | -- | -- |
Source: Public Records
Mortgage History
| Date | Status | Borrower | Loan Amount |
|---|---|---|---|
| Open | Bakardjiev Dimitar | $58,410 | |
| Open | Bakardjiev Dimitar | $472,000 | |
| Previous Owner | Mackay Gareth P | $535,158 |
Source: Public Records
Tax History
| Year | Tax Paid | Tax Assessment Tax Assessment Total Assessment is a certain percentage of the fair market value that is determined by local assessors to be the total taxable value of land and additions on the property. | Land | Improvement |
|---|---|---|---|---|
| 2025 | $8,276 | $730,874 | $567,268 | $163,606 |
| 2024 | $8,276 | $716,545 | $556,146 | $160,399 |
| 2023 | $8,123 | $702,496 | $545,242 | $157,254 |
| 2022 | $8,013 | $688,722 | $534,551 | $154,171 |
| 2021 | $7,869 | $675,219 | $524,070 | $151,149 |
| 2020 | $7,751 | $668,297 | $518,697 | $149,600 |
| 2019 | $7,640 | $655,194 | $508,527 | $146,667 |
| 2018 | $7,197 | $625,284 | $498,556 | $126,728 |
| 2016 | $6,858 | $598,997 | $479,198 | $119,799 |
| 2015 | $6,708 | $590,000 | $472,000 | $118,000 |
| 2014 | $6,787 | $594,683 | $535,752 | $58,931 |
Source: Public Records
Map
Nearby Homes
- 1208 Maple Ave
- 1319 Kornblum Ave
- 2751 Sonoma St
- 2940 W Carson St Unit 213
- 2940 W Carson St Unit 207
- 3030 Merrill Dr Unit 7
- 1745 Maple Ave Unit 59
- 1307 Greenwood Ave
- 1023 Patronella Ave
- 3538 Torrance Blvd
- 2889 Plaza Del Amo Unit 515
- 2889 Plaza Del Amo Unit 405
- 2971 Plaza Del Amo Unit 281
- 1509 Elm Ave
- 3550 Torrance Blvd Unit 313
- 3550 Torrance Blvd Unit 209
- 2300 Maple Ave Unit 80
- 2300 Maple Ave Unit 140
- 2595 Plaza Del Amo Unit 424
- 2615 Plaza Del Amo Unit 606
- 1313 Maple Ave
- 1309 Maple Ave
- 1316 Florwood Ave
- 1310 Florwood Ave
- 2942 Opal St
- 1306 Florwood Ave
- 1226 Maple Ave
- 1220 Maple Ave
- 2938 Opal St
- 3001 Opal St
- 2947 El Dorado St
- 3009 Opal St
- 1216 Maple Ave
- 2934 Opal St
- 3017 Opal St
- 1317 Florwood Ave
- 1212 Maple Ave
- 2941 El Dorado St
- 1321 Florwood Ave
- 1313 Florwood Ave
Your Personal Tour Guide
Ask me questions while you tour the home.