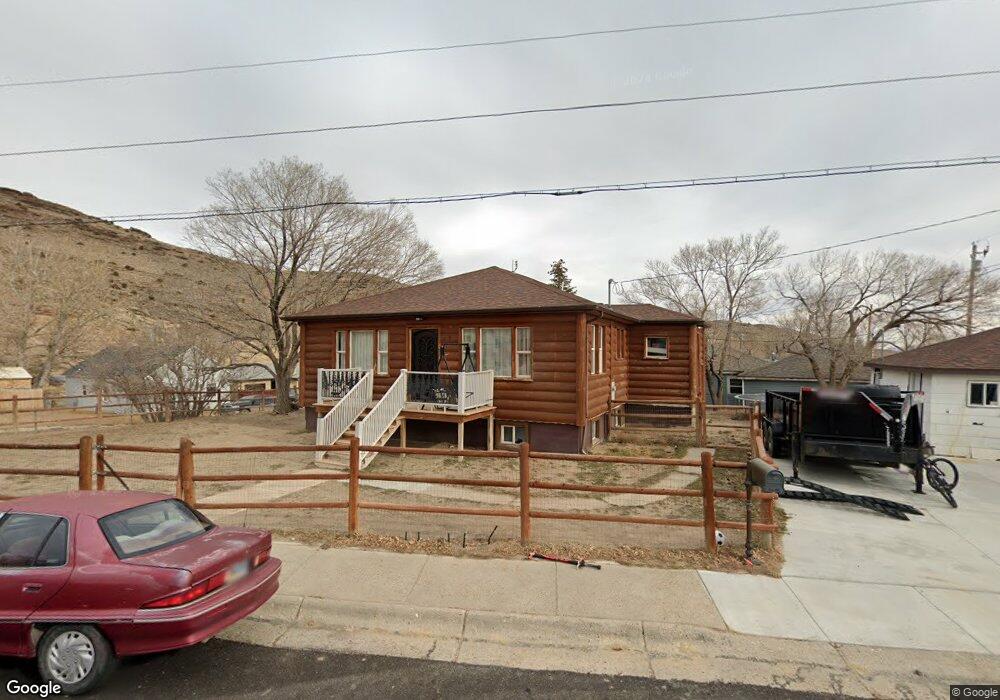
1317 Mountain View Blvd Unit Neiman Rawlins, WY 82301
Estimated Value: $229,000 - $254,614
5
Beds
2
Baths
2,400
Sq Ft
$100/Sq Ft
Est. Value
About This Home
This home is located at 1317 Mountain View Blvd Unit Neiman, Rawlins, WY 82301 and is currently estimated at $240,904, approximately $100 per square foot. 1317 Mountain View Blvd Unit Neiman is a home located in Carbon County with nearby schools including Rawlins Elementary School, Rawlins Middle School, and Rawlins High School.
Ownership History
Date
Name
Owned For
Owner Type
Purchase Details
Closed on
Apr 16, 2018
Sold by
Bangs Beau W and Bangs Danielle E
Bought by
Garner Anthony J and Gravitt Tosha M
Current Estimated Value
Home Financials for this Owner
Home Financials are based on the most recent Mortgage that was taken out on this home.
Original Mortgage
$195,886
Outstanding Balance
$168,445
Interest Rate
4.62%
Mortgage Type
FHA
Estimated Equity
$72,459
Purchase Details
Closed on
Nov 16, 2005
Sold by
Hartman Robert J
Bought by
Bangs Beau W
Home Financials for this Owner
Home Financials are based on the most recent Mortgage that was taken out on this home.
Original Mortgage
$119,000
Interest Rate
8.5%
Mortgage Type
Adjustable Rate Mortgage/ARM
Create a Home Valuation Report for This Property
The Home Valuation Report is an in-depth analysis detailing your home's value as well as a comparison with similar homes in the area
Home Values in the Area
Average Home Value in this Area
Purchase History
| Date | Buyer | Sale Price | Title Company |
|---|---|---|---|
| Garner Anthony J | -- | First American Title | |
| Garner Anthony J | -- | First American Title | |
| Bangs Beau W | -- | None Available |
Source: Public Records
Mortgage History
| Date | Status | Borrower | Loan Amount |
|---|---|---|---|
| Open | Garner Anthony J | $195,886 | |
| Closed | Garner Anthony J | $195,886 | |
| Previous Owner | Bangs Beau W | $119,000 |
Source: Public Records
Tax History Compared to Growth
Tax History
| Year | Tax Paid | Tax Assessment Tax Assessment Total Assessment is a certain percentage of the fair market value that is determined by local assessors to be the total taxable value of land and additions on the property. | Land | Improvement |
|---|---|---|---|---|
| 2025 | $1,687 | $17,595 | $2,781 | $14,814 |
| 2024 | $1,687 | $23,363 | $3,708 | $19,655 |
| 2023 | $1,735 | $24,027 | $3,371 | $20,656 |
| 2022 | $1,542 | $21,065 | $3,371 | $17,694 |
| 2021 | $1,542 | $19,585 | $2,119 | $17,466 |
| 2020 | $1,404 | $58,239 | $6,357 | $51,882 |
| 2019 | $1,322 | $18,382 | $2,119 | $16,263 |
| 2018 | $1,303 | $17,829 | $2,119 | $15,710 |
| 2017 | $1,276 | $17,554 | $2,119 | $15,435 |
| 2016 | $1,257 | $17,294 | $2,119 | $15,175 |
| 2015 | -- | $16,653 | $2,119 | $14,534 |
| 2014 | -- | $16,956 | $2,119 | $14,837 |
Source: Public Records
Map
Nearby Homes
- 1317 Mountain View Blvd
- 1212 Nieman St
- 1208 Nieman St
- 1211 Veterans Ave
- 1211 Veterans Ave Unit 11th Street
- 1316 Mountain View Blvd
- 1120 Nieman St
- 1320 Mountain View Blvd
- 1213 Nieman St
- 1322 Mountain View Blvd
- 1207 Veterans Ave
- 1333 Mountain View Blvd
- 1209 Nieman St
- 1310 Mountain View Blvd
- 1330 Mountain View Blvd
- 1203 Veterans Ave
- 1220 Mountain View Blvd
- 1205 Nieman St
- 1121 Veterans Ave
- 1118 Nieman St