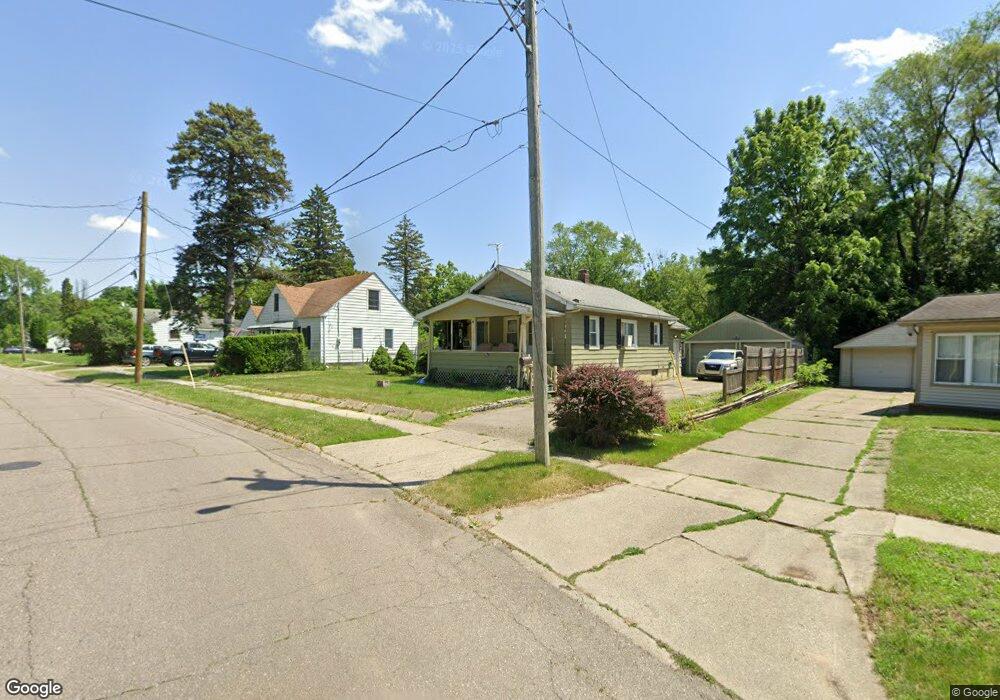
1317 Pinehurst Ave Flint, MI 48507
Westgate NeighborhoodEstimated Value: $41,000 - $70,214
2
Beds
1
Bath
784
Sq Ft
$70/Sq Ft
Est. Value
About This Home
This home is located at 1317 Pinehurst Ave, Flint, MI 48507 and is currently estimated at $55,054, approximately $70 per square foot. 1317 Pinehurst Ave is a home located in Genesee County with nearby schools including Neithercut Elementary School, Flint Southwestern Classical Academy, and International Academy of Flint (K-12).
Ownership History
Date
Name
Owned For
Owner Type
Purchase Details
Closed on
Mar 16, 2018
Sold by
Garner Taiwan L
Bought by
810 Home Buyers 1 Llc
Current Estimated Value
Purchase Details
Closed on
Mar 12, 2018
Sold by
Providence Assets Llc
Bought by
Garner Tarwan L
Purchase Details
Closed on
Oct 12, 2017
Sold by
Kingdom First Properties Llc
Bought by
Providence Assets Llc
Purchase Details
Closed on
Oct 20, 2016
Sold by
Kingdom First Properties Llc
Bought by
Garner Taiwan L
Purchase Details
Closed on
Aug 3, 2016
Sold by
Wells Fargo Bank Na
Bought by
Kingdom First Properties Llc
Purchase Details
Closed on
Feb 17, 2016
Sold by
Sevenski Byron and Cifuentes Vanessa
Bought by
Wells Fargo Bank Na
Purchase Details
Closed on
May 2, 2003
Sold by
Elizondo Kimberly L
Bought by
Sevenski Byron and Cifuentes Vanessa
Purchase Details
Closed on
Oct 30, 2002
Sold by
Elizondo Vincent R and Elizondo Kimberly L
Bought by
Elizondo Kimberly L
Create a Home Valuation Report for This Property
The Home Valuation Report is an in-depth analysis detailing your home's value as well as a comparison with similar homes in the area
Home Values in the Area
Average Home Value in this Area
Purchase History
| Date | Buyer | Sale Price | Title Company |
|---|---|---|---|
| 810 Home Buyers 1 Llc | $21,500 | Cislo Title Co | |
| Garner Tarwan L | $15,000 | Cislo Title Services | |
| Providence Assets Llc | $1,000 | None Available | |
| Garner Taiwan L | $15,000 | None Available | |
| Kingdom First Properties Llc | $1,000 | None Available | |
| Wells Fargo Bank Na | $11,060 | Attorney | |
| Sevenski Byron | $61,620 | Metropolitan Title Company | |
| Elizondo Kimberly L | -- | First American Title Ins Co |
Source: Public Records
Tax History
| Year | Tax Paid | Tax Assessment Tax Assessment Total Assessment is a certain percentage of the fair market value that is determined by local assessors to be the total taxable value of land and additions on the property. | Land | Improvement |
|---|---|---|---|---|
| 2025 | $1,060 | $20,400 | $0 | $0 |
| 2024 | $958 | $21,100 | $0 | $0 |
| 2023 | $939 | $17,000 | $0 | $0 |
| 2022 | $0 | $14,500 | $0 | $0 |
| 2021 | $978 | $13,100 | $0 | $0 |
| 2020 | $888 | $13,100 | $0 | $0 |
| 2019 | $1,004 | $13,400 | $0 | $0 |
| 2018 | $1,069 | $12,200 | $0 | $0 |
| 2017 | $1,041 | $0 | $0 | $0 |
| 2016 | $788 | $0 | $0 | $0 |
| 2015 | -- | $0 | $0 | $0 |
| 2014 | -- | $0 | $0 | $0 |
| 2012 | -- | $14,700 | $0 | $0 |
Source: Public Records
Map
Nearby Homes
- 1318 Ingleside Ave
- 1210 Pinehurst Ave
- 1310 Huron St
- 1234 Huron St
- 1122 Markham St
- 1627 Blackberry Ln
- 1826 Greenbrook Ln
- 1015 Alvord Ave
- 4502 Huckleberry Ln
- 3312 Renault Dr
- 1410 Berrywood Ln
- 1247 Catalina Dr
- 912 Huron St
- 1028 Campbell St
- 846 W Hemphill Rd
- 1130 W Atherton Rd
- Lot 57 Walnut Creek Dr
- 845 Alvord Ave
- 829 Clinton St
- 3902 Brunswick Ave
- 1301 Pinehurst Ave
- 1309 Pinehurst Ave
- 1306 Markham St
- 1322 Pinehurst Ave
- 1314 Markham St
- 1306 Pinehurst Ave
- 1402 Crestbrook Ln
- 1302 Pinehurst Ave
- 1401 Crestbrook Ln
- 1240 Pinehurst Ave
- 1238 Markham St
- 1235 Pinehurst Ave
- 1233 Pinehurst Ave
- 1238 Pinehurst Ave
- 1234 Markham St
- 1411 Crestbrook Ln
- 1309 Ingleside Ave
- 1313 Ingleside Ave
- 1317 Ingleside Ave
- 1234 Pinehurst Ave
Your Personal Tour Guide
Ask me questions while you tour the home.