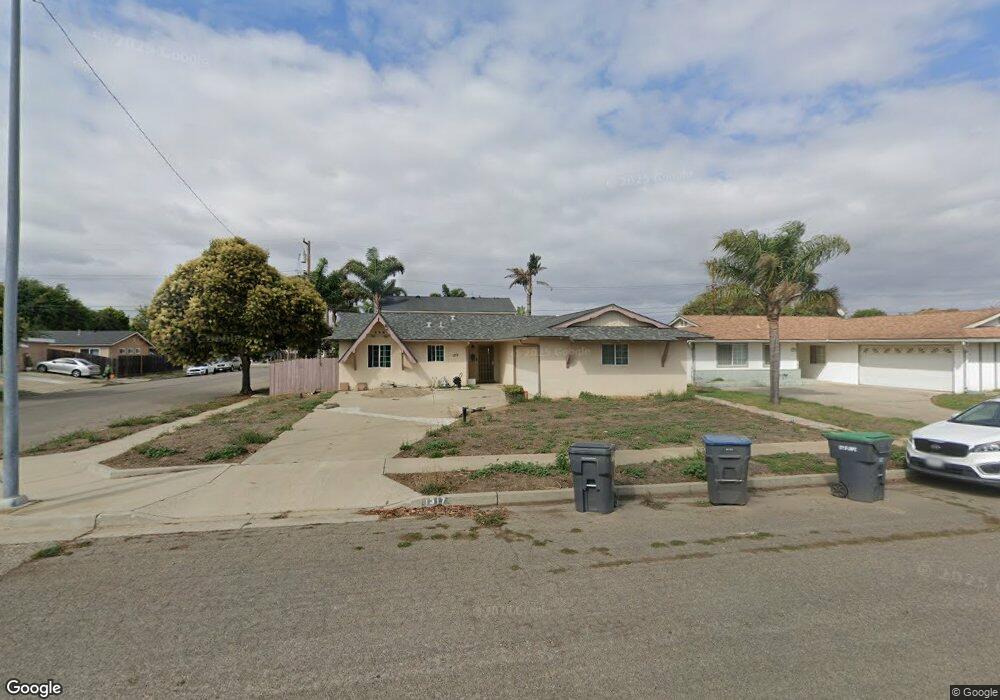
1317 W Guava Ave Lompoc, CA 93436
West Lompoc NeighborhoodEstimated Value: $470,269 - $602,000
3
Beds
2
Baths
1,281
Sq Ft
$409/Sq Ft
Est. Value
About This Home
This home is located at 1317 W Guava Ave, Lompoc, CA 93436 and is currently estimated at $523,817, approximately $408 per square foot. 1317 W Guava Ave is a home located in Santa Barbara County with nearby schools including Miguelito Elementary School, Lompoc Valley Middle School, and Lompoc High School.
Ownership History
Date
Name
Owned For
Owner Type
Purchase Details
Closed on
Apr 1, 2005
Sold by
Le Mark Hoanguy
Bought by
Le Mark Hoanguy and Vu Ngocyen Thi
Current Estimated Value
Purchase Details
Closed on
Aug 16, 1999
Sold by
Vu Ngoc Yen Thi
Bought by
Le Mark Hoanguy
Home Financials for this Owner
Home Financials are based on the most recent Mortgage that was taken out on this home.
Original Mortgage
$108,000
Outstanding Balance
$30,419
Interest Rate
7.63%
Estimated Equity
$493,398
Purchase Details
Closed on
Jul 22, 1999
Sold by
Laney Wilson C & Frances B Living Trust and Frances B
Bought by
Le Mark Hoanguy
Home Financials for this Owner
Home Financials are based on the most recent Mortgage that was taken out on this home.
Original Mortgage
$108,000
Outstanding Balance
$30,419
Interest Rate
7.63%
Estimated Equity
$493,398
Purchase Details
Closed on
Dec 9, 1994
Sold by
Laney Wilson C and Laney Frances B
Bought by
Laney Wilson C and Laney Frances B
Create a Home Valuation Report for This Property
The Home Valuation Report is an in-depth analysis detailing your home's value as well as a comparison with similar homes in the area
Home Values in the Area
Average Home Value in this Area
Purchase History
| Date | Buyer | Sale Price | Title Company |
|---|---|---|---|
| Le Mark Hoanguy | -- | Chicago Title Company | |
| Le Mark Hoanguy | -- | Chicago Title Co | |
| Le Mark Hoanguy | $135,000 | Chicago Title Co | |
| Laney Wilson C | -- | -- |
Source: Public Records
Mortgage History
| Date | Status | Borrower | Loan Amount |
|---|---|---|---|
| Open | Le Mark Hoanguy | $108,000 | |
| Closed | Le Mark Hoanguy | $13,500 |
Source: Public Records
Tax History Compared to Growth
Tax History
| Year | Tax Paid | Tax Assessment Tax Assessment Total Assessment is a certain percentage of the fair market value that is determined by local assessors to be the total taxable value of land and additions on the property. | Land | Improvement |
|---|---|---|---|---|
| 2025 | $2,288 | $222,467 | $84,520 | $137,947 |
| 2023 | $2,288 | $199,413 | $81,239 | $118,174 |
| 2022 | $2,248 | $195,504 | $79,647 | $115,857 |
| 2021 | $2,271 | $191,672 | $78,086 | $113,586 |
| 2020 | $2,248 | $189,708 | $77,286 | $112,422 |
| 2019 | $2,210 | $185,989 | $75,771 | $110,218 |
| 2018 | $2,176 | $182,343 | $74,286 | $108,057 |
| 2017 | $2,136 | $178,769 | $72,830 | $105,939 |
| 2016 | $2,098 | $175,264 | $71,402 | $103,862 |
| 2015 | $2,082 | $172,632 | $70,330 | $102,302 |
| 2014 | $2,053 | $169,252 | $68,953 | $100,299 |
Source: Public Records
Map
Nearby Homes
- 309 N V St
- 1426 Plum Ave
- 23 Village Circle Dr
- 1317 W Cypress Ave Unit A2
- 1105 W Cypress Ave Unit J
- 500 N Z St
- 531 N O St
- 401 S R St
- 428 S Z St
- 413 S O Place
- 1328 W Willow Ave
- 135 N J St
- 300 W Walnut Ave
- 137 N J St
- 816 N O St Unit 113
- 906 N P St
- 4314 W Ocean Ave
- 510 N I St
- 1006 Tranquillion Ct
- 1036 Armstrong St Unit III