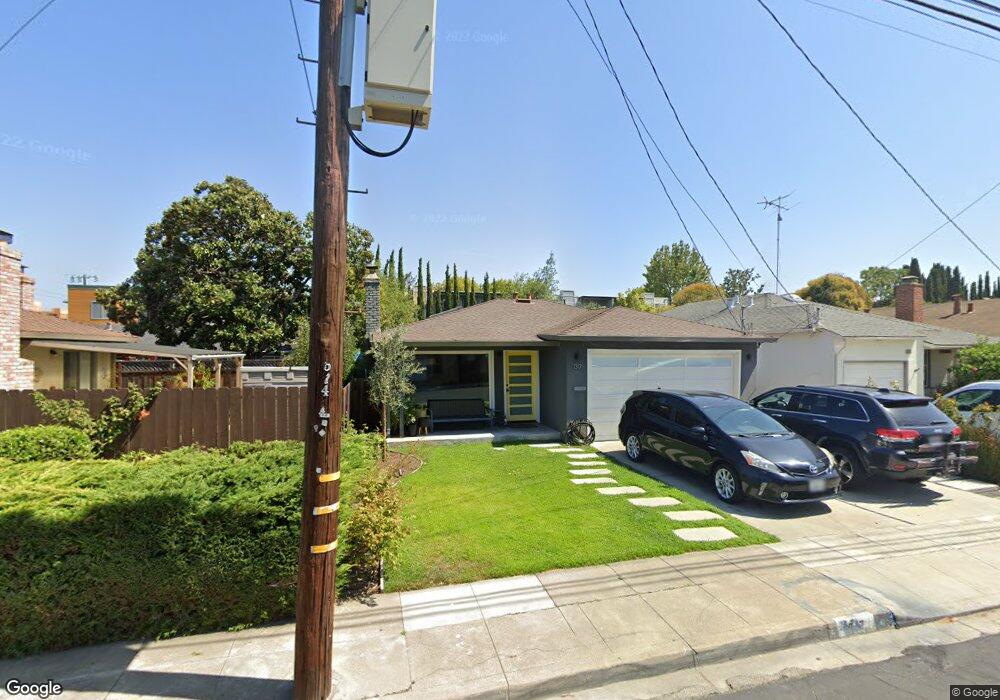
1317 Walnut St San Carlos, CA 94070
El Sereno Corte NeighborhoodEstimated Value: $1,979,744 - $2,165,000
3
Beds
1
Bath
1,210
Sq Ft
$1,697/Sq Ft
Est. Value
About This Home
This home is located at 1317 Walnut St, San Carlos, CA 94070 and is currently estimated at $2,053,186, approximately $1,696 per square foot. 1317 Walnut St is a home located in San Mateo County with nearby schools including White Oaks Elementary School, Central Middle School, and Sequoia High School.
Ownership History
Date
Name
Owned For
Owner Type
Purchase Details
Closed on
Jun 23, 2010
Sold by
Sallen Christopher D and Chapman Catherine
Bought by
Sallen Christopher D and Chapman Catherine
Current Estimated Value
Home Financials for this Owner
Home Financials are based on the most recent Mortgage that was taken out on this home.
Original Mortgage
$553,000
Outstanding Balance
$369,529
Interest Rate
4.91%
Mortgage Type
New Conventional
Estimated Equity
$1,683,657
Purchase Details
Closed on
May 28, 2009
Sold by
Delucchi Ellen Jane
Bought by
Sallen Christopher D and Chapman Catherine
Home Financials for this Owner
Home Financials are based on the most recent Mortgage that was taken out on this home.
Original Mortgage
$559,200
Interest Rate
4.78%
Mortgage Type
Purchase Money Mortgage
Purchase Details
Closed on
Dec 18, 2000
Sold by
Delucchi Ellen Jane
Bought by
Delucchi Ellen Jane and De Lucchi Revocable Living Trust
Create a Home Valuation Report for This Property
The Home Valuation Report is an in-depth analysis detailing your home's value as well as a comparison with similar homes in the area
Home Values in the Area
Average Home Value in this Area
Purchase History
| Date | Buyer | Sale Price | Title Company |
|---|---|---|---|
| Sallen Christopher D | -- | Old Republic Title Company | |
| Sallen Christopher D | $699,000 | Fidelity National Title Co | |
| Delucchi Ellen Jane | -- | -- |
Source: Public Records
Mortgage History
| Date | Status | Borrower | Loan Amount |
|---|---|---|---|
| Open | Sallen Christopher D | $553,000 | |
| Closed | Sallen Christopher D | $559,200 |
Source: Public Records
Tax History Compared to Growth
Tax History
| Year | Tax Paid | Tax Assessment Tax Assessment Total Assessment is a certain percentage of the fair market value that is determined by local assessors to be the total taxable value of land and additions on the property. | Land | Improvement |
|---|---|---|---|---|
| 2025 | $11,724 | $900,126 | $450,063 | $450,063 |
| 2023 | $11,724 | $865,176 | $432,588 | $432,588 |
| 2022 | $11,046 | $848,212 | $424,106 | $424,106 |
| 2021 | $10,881 | $831,582 | $415,791 | $415,791 |
| 2020 | $10,751 | $823,056 | $411,528 | $411,528 |
| 2019 | $10,535 | $806,918 | $403,459 | $403,459 |
| 2018 | $10,254 | $791,098 | $395,549 | $395,549 |
| 2017 | $10,111 | $775,588 | $387,794 | $387,794 |
| 2016 | $9,891 | $760,382 | $380,191 | $380,191 |
| 2015 | $9,857 | $748,962 | $374,481 | $374,481 |
| 2014 | $9,544 | $734,292 | $367,146 | $367,146 |
Source: Public Records
Map
Nearby Homes
- 1463 Greenwood Ave
- 1761 Laurel St
- 1400 Oakhurst Ave
- 136 Finger Ave Unit 138
- 112 F St
- 1471 Cordilleras Ave
- 2256 Howard Ave
- 782 Elm St Unit C
- 352 Oakview Dr
- 125 Warwick St
- 728 Elm St Unit 205
- 55 Claremont Ave Unit 301
- 956 Tamarack Ave
- 161 Oakview Dr
- 1140 Whipple Ave Unit 21
- 1140 Whipple Ave Unit 22
- 503 Arlington Rd
- 1555 Cherry St Unit 12
- 61 Hilltop Dr
- 657 Walnut St Unit 301
- 1325 Walnut St
- 1259 Howard Ave
- 1333 Walnut St
- 1247 Howard Ave
- 1309 Walnut St
- 1330 Laurel St
- 1235 Howard Ave Unit 3
- 1341 Walnut St
- 1223 Howard Ave
- 1300 Walnut St
- 1349 Walnut St
- 1316 Walnut St
- 1324 Walnut St
- 1332 Walnut St
- 1312 Laurel St Unit 202
- 1312 Laurel St Unit 201
- 1312 Laurel St
- 1315 Howard Ave
- 1357 Walnut St
- 1340 Walnut St