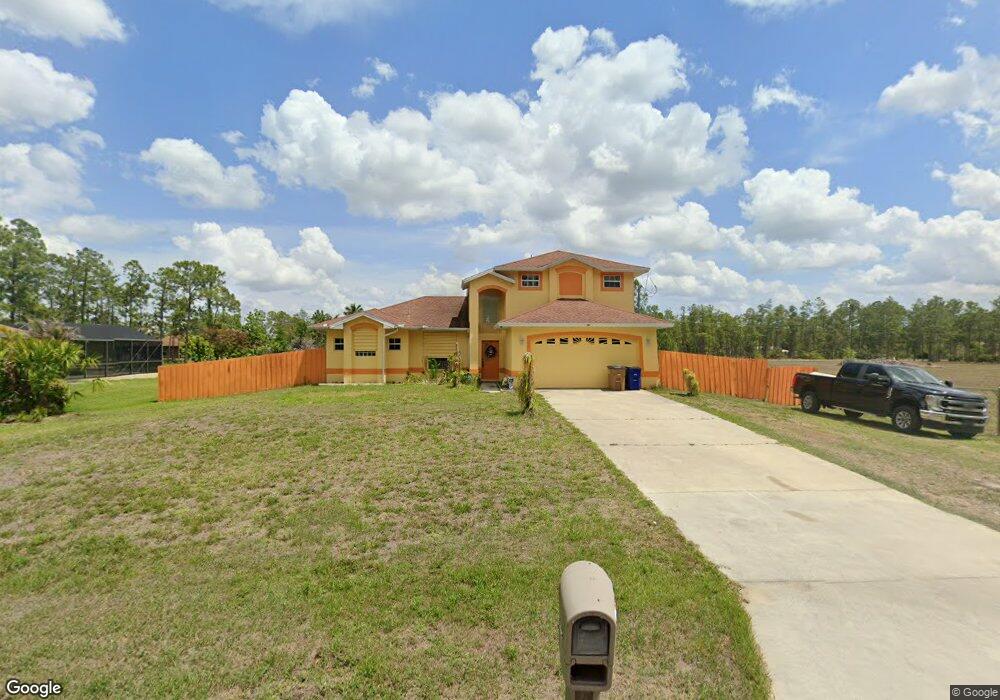
1318 8th Ave Lehigh Acres, FL 33972
Joel NeighborhoodEstimated Value: $334,000 - $351,000
3
Beds
3
Baths
1,887
Sq Ft
$180/Sq Ft
Est. Value
About This Home
This home is located at 1318 8th Ave, Lehigh Acres, FL 33972 and is currently estimated at $340,329, approximately $180 per square foot. 1318 8th Ave is a home located in Lee County with nearby schools including Lehigh Elementary School, The Alva School, and Gateway Elementary School.
Ownership History
Date
Name
Owned For
Owner Type
Purchase Details
Closed on
Feb 26, 2021
Sold by
Worthington Alena M and The Alena M Worthington Trust
Bought by
Raban Charles Edward and Raban Wimberly Saunders
Current Estimated Value
Home Financials for this Owner
Home Financials are based on the most recent Mortgage that was taken out on this home.
Original Mortgage
$250,635
Outstanding Balance
$224,165
Interest Rate
2.7%
Mortgage Type
VA
Estimated Equity
$116,164
Purchase Details
Closed on
Apr 24, 2020
Sold by
Worthington Alena M and Worthington Edward Peter
Bought by
Worthington Alena M and Alena M Worthington Trust
Purchase Details
Closed on
Oct 25, 2013
Sold by
Mcgregor Calvin and Williams Aubrey
Bought by
Worthington Edward P and Worthington Alena M
Purchase Details
Closed on
Mar 13, 2002
Sold by
Campbell Edna H
Bought by
Mcgregor Lloyd Sylvester and Mcgregor Enid Advira
Create a Home Valuation Report for This Property
The Home Valuation Report is an in-depth analysis detailing your home's value as well as a comparison with similar homes in the area
Home Values in the Area
Average Home Value in this Area
Purchase History
| Date | Buyer | Sale Price | Title Company |
|---|---|---|---|
| Raban Charles Edward | $245,000 | Aaccurate Ttl Svcs Of Sw Fl | |
| Worthington Alena M | -- | None Available | |
| Worthington Edward P | $82,500 | Aaccurate Title Services Of | |
| Mcgregor Lloyd Sylvester | $4,500 | -- |
Source: Public Records
Mortgage History
| Date | Status | Borrower | Loan Amount |
|---|---|---|---|
| Open | Raban Charles Edward | $250,635 |
Source: Public Records
Tax History Compared to Growth
Tax History
| Year | Tax Paid | Tax Assessment Tax Assessment Total Assessment is a certain percentage of the fair market value that is determined by local assessors to be the total taxable value of land and additions on the property. | Land | Improvement |
|---|---|---|---|---|
| 2025 | $3,511 | $196,217 | $24,225 | $156,628 |
| 2024 | $3,414 | $262,504 | -- | -- |
| 2023 | $3,414 | $254,858 | $14,852 | $220,429 |
| 2022 | $3,429 | $262,866 | $19,512 | $243,354 |
| 2021 | $2,953 | $185,172 | $13,980 | $171,192 |
| 2020 | $1,460 | $101,469 | $0 | $0 |
| 2019 | $1,453 | $99,188 | $0 | $0 |
| 2018 | $1,420 | $97,339 | $0 | $0 |
| 2017 | $1,378 | $95,337 | $0 | $0 |
| 2016 | $1,340 | $116,509 | $10,054 | $106,455 |
| 2015 | $1,333 | $95,694 | $8,724 | $86,970 |
| 2014 | $1,767 | $88,706 | $3,000 | $85,706 |
| 2013 | -- | $71,095 | $3,200 | $67,895 |
Source: Public Records
Map
Nearby Homes
- 601 E 14th St
- 1226 Lincoln Ave
- 1442 Lincoln Ave
- 503 E 13th St
- 124 Whitman Ct
- 2004 W 17th St
- 1420 Cleveland Ave
- 402 Thompson Ave
- 548 Lakeridge Blvd
- 301/303 12th St W
- 676 Sabrina Ct
- 607 Eighth Ave
- 1836 Jacinto Ave
- 2139 Viscount Ave
- 1917 Montero Ave
- 902 8th Ave
- 412 Lakeridge Blvd
- 2120 Oceano St
- 1921 Scott Ave
- 1842 Ottoman St
- 1318 Eighth Ave
- 1320 8th Ave Unit 4
- 800 E 14th St
- 1319 Lake Ave
- 1319 8th Ave
- 1317 8th Ave
- 1601 Eighth Ave
- 907 Eighth Ave
- 909 Eighth Ave
- 1605 Eighth Ave
- 1323 8th Ave
- 806 E 14th St Unit 4
- 1310 8th Ave
- 1318 Greenwood Ave
- 900 E 14th St
- 1320 Lake Ave Unit 4
- 1311 8th Ave
- 1311 Eighth Ave
- 1403 Lake Ave
- 1403 18th Ave