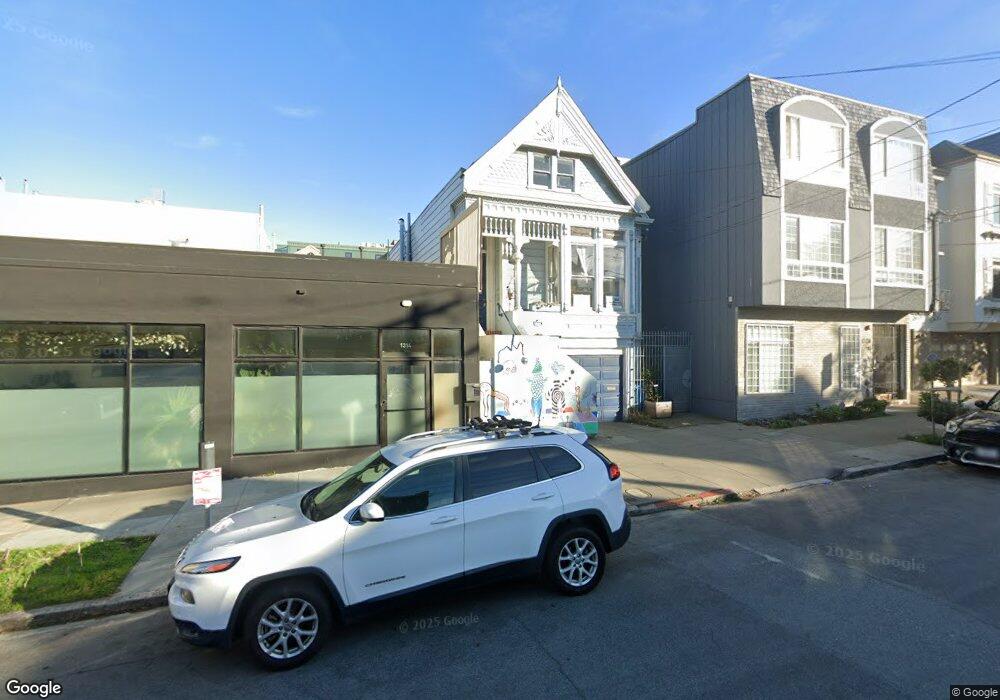
1318 8th Ave San Francisco, CA 94122
Inner Sunset NeighborhoodEstimated Value: $1,445,411 - $2,326,000
2
Beds
1
Bath
1,267
Sq Ft
$1,587/Sq Ft
Est. Value
About This Home
This home is located at 1318 8th Ave, San Francisco, CA 94122 and is currently estimated at $2,010,353, approximately $1,586 per square foot. 1318 8th Ave is a home located in San Francisco County with nearby schools including Grattan Elementary, Giannini (A.P.) Middle School, and St Anne School.
Ownership History
Date
Name
Owned For
Owner Type
Purchase Details
Closed on
Dec 21, 2006
Sold by
Krouzian Arlene Alice
Bought by
Krouzian Arlene Alice
Current Estimated Value
Purchase Details
Closed on
Nov 2, 1998
Sold by
Decalderon Alicia
Bought by
Rosas Alicia
Purchase Details
Closed on
Feb 15, 1998
Sold by
Rosas Raquel and Reynoso Raquel
Bought by
Decalderon Alicia
Purchase Details
Closed on
Jul 31, 1997
Sold by
Molinari John G
Bought by
Krouzian Arlene Alice
Purchase Details
Closed on
Sep 23, 1993
Sold by
Bank Of The Orient
Bought by
Strauch Michael A and Benyon Strauch Jane
Home Financials for this Owner
Home Financials are based on the most recent Mortgage that was taken out on this home.
Original Mortgage
$421,600
Interest Rate
7.13%
Create a Home Valuation Report for This Property
The Home Valuation Report is an in-depth analysis detailing your home's value as well as a comparison with similar homes in the area
Home Values in the Area
Average Home Value in this Area
Purchase History
| Date | Buyer | Sale Price | Title Company |
|---|---|---|---|
| Krouzian Arlene Alice | -- | None Available | |
| Rosas Alicia | -- | -- | |
| Decalderon Alicia | -- | -- | |
| Decalderon Alicia | -- | -- | |
| Krouzian Arlene Alice | -- | -- | |
| Strauch Michael A | $527,000 | Fidelity National Title |
Source: Public Records
Mortgage History
| Date | Status | Borrower | Loan Amount |
|---|---|---|---|
| Previous Owner | Strauch Michael A | $421,600 |
Source: Public Records
Tax History Compared to Growth
Tax History
| Year | Tax Paid | Tax Assessment Tax Assessment Total Assessment is a certain percentage of the fair market value that is determined by local assessors to be the total taxable value of land and additions on the property. | Land | Improvement |
|---|---|---|---|---|
| 2025 | $4,242 | $291,282 | $195,221 | $96,061 |
| 2024 | $4,242 | $285,572 | $191,394 | $94,178 |
| 2023 | $4,123 | $279,974 | $187,642 | $92,332 |
| 2022 | $4,023 | $274,485 | $183,963 | $90,522 |
| 2021 | $3,948 | $269,104 | $180,356 | $88,748 |
| 2020 | $4,034 | $266,345 | $178,507 | $87,838 |
| 2019 | $3,904 | $261,123 | $175,007 | $86,116 |
| 2018 | $3,773 | $256,004 | $171,576 | $84,428 |
| 2017 | $3,431 | $250,985 | $168,212 | $82,773 |
| 2016 | $3,346 | $246,064 | $164,914 | $81,150 |
| 2015 | $3,301 | $242,369 | $162,437 | $79,932 |
| 2014 | $3,217 | $237,623 | $159,256 | $78,367 |
Source: Public Records
Map
Nearby Homes
- 1300 7th Ave Unit 1
- 1360 9th Ave Unit 7
- 652 Parnassus Ave
- 1264 3rd Ave
- 1392 Funston Ave
- 1228 Funston Ave
- 1515 11th Ave
- 40 Irving St
- 1635 10th Ave Unit 5
- 450 Carl St
- 327 Crestmont Dr Unit 329
- 327-329 Crestmont Dr
- 683 Frederick St
- 1723-1725 7th Ave
- 1349 17th Ave
- 1701 Funston Ave Unit 1703
- 124 Noriega St
- 1808 8th Ave Unit 1810
- 1810 8th Ave
- 1346 Judah St
- 1324 8th Ave
- 1326 8th Ave
- 1330 8th Ave
- 1334 8th Ave
- 627 Irving St
- 1315 7th Ave
- 1327 7th Ave Unit 6
- 1327 7th Ave Unit 2
- 1327 7th Ave Unit 9
- 1327 7th Ave Unit 8
- 1327 7th Ave Unit 5
- 1327 7th Ave Unit 4
- 1327 7th Ave Unit 7
- 1327 7th Ave Unit 3
- 1327 7th Ave Unit 11
- 1327 7th Ave Unit 10
- 1327 7th Ave Unit 1
- 1327 7th Ave
- 1327 7th Ave Unit 1327
- 1327 7th Ave Unit 1327