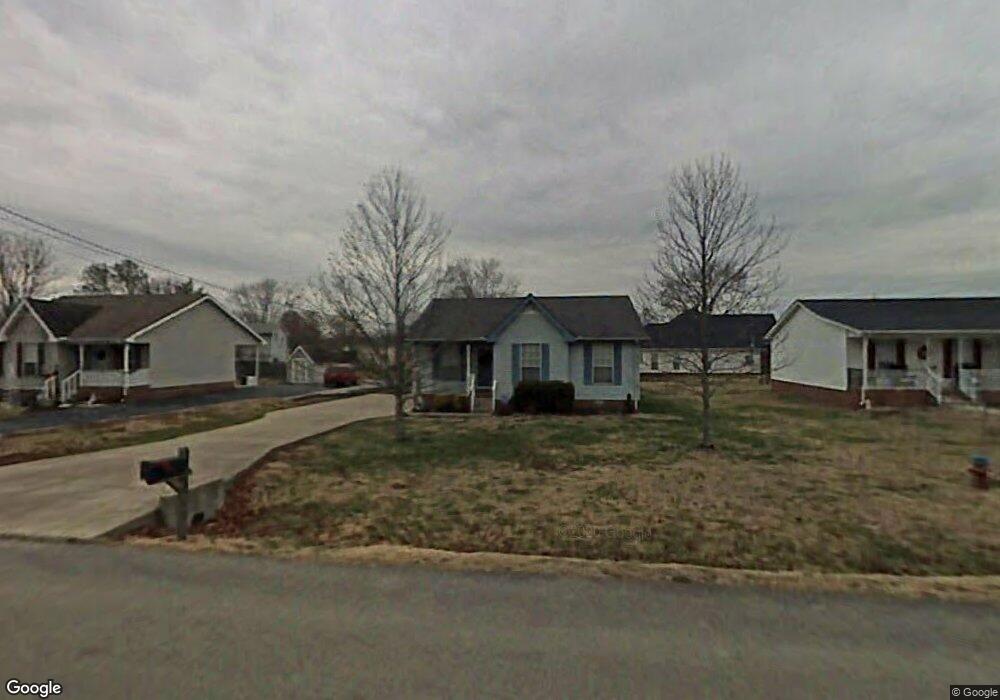
1318 Raden Dr Lebanon, TN 37087
Estimated Value: $232,000 - $290,000
--
Bed
2
Baths
1,067
Sq Ft
$253/Sq Ft
Est. Value
About This Home
This home is located at 1318 Raden Dr, Lebanon, TN 37087 and is currently estimated at $269,434, approximately $252 per square foot. 1318 Raden Dr is a home located in Wilson County with nearby schools including Sam Houston Elementary School, Walter J. Baird Middle School, and Lebanon High School.
Ownership History
Date
Name
Owned For
Owner Type
Purchase Details
Closed on
Apr 16, 2018
Sold by
Carney Thomas and Carney Mary Ellen
Bought by
Carney Sandra L
Current Estimated Value
Home Financials for this Owner
Home Financials are based on the most recent Mortgage that was taken out on this home.
Original Mortgage
$118,131
Outstanding Balance
$103,141
Interest Rate
5.12%
Mortgage Type
FHA
Estimated Equity
$166,293
Purchase Details
Closed on
Jul 20, 2016
Sold by
Turner Joyce Sellars
Bought by
Carney Thomas and Carney Mary Ellen
Purchase Details
Closed on
Oct 16, 1998
Bought by
Joyce Sellars
Purchase Details
Closed on
Aug 26, 1996
Sold by
Cooper Joey C
Bought by
Donlad Patton John
Purchase Details
Closed on
Feb 25, 1992
Bought by
Cooper Joey C
Purchase Details
Closed on
Nov 26, 1991
Bought by
Tomlinson Robert E and Tomlinson Cathryn
Purchase Details
Closed on
Apr 4, 1904
Bought by
Walker Joe
Create a Home Valuation Report for This Property
The Home Valuation Report is an in-depth analysis detailing your home's value as well as a comparison with similar homes in the area
Home Values in the Area
Average Home Value in this Area
Purchase History
| Date | Buyer | Sale Price | Title Company |
|---|---|---|---|
| Carney Sandra L | $129,000 | None Available | |
| Carney Thomas | $129,000 | Horizon Land Title Inc | |
| Joyce Sellars | $85,000 | -- | |
| Donlad Patton John | $79,000 | -- | |
| Cooper Joey C | $55,000 | -- | |
| Tomlinson Robert E | $4,000 | -- | |
| Walker Joe | -- | -- |
Source: Public Records
Mortgage History
| Date | Status | Borrower | Loan Amount |
|---|---|---|---|
| Open | Carney Sandra L | $118,131 |
Source: Public Records
Tax History Compared to Growth
Tax History
| Year | Tax Paid | Tax Assessment Tax Assessment Total Assessment is a certain percentage of the fair market value that is determined by local assessors to be the total taxable value of land and additions on the property. | Land | Improvement |
|---|---|---|---|---|
| 2024 | $951 | $43,100 | $15,000 | $28,100 |
| 2022 | $1,223 | $42,275 | $15,000 | $27,275 |
| 2021 | $1,222 | $42,275 | $15,000 | $27,275 |
| 2020 | $1,087 | $42,275 | $15,000 | $27,275 |
| 2019 | $248 | $28,900 | $9,150 | $19,750 |
| 2018 | $1,015 | $28,900 | $9,150 | $19,750 |
| 2017 | $1,015 | $28,900 | $9,150 | $19,750 |
| 2016 | $1,015 | $28,900 | $9,150 | $19,750 |
| 2015 | $1,048 | $28,900 | $9,150 | $19,750 |
| 2014 | $880 | $24,247 | $0 | $0 |
Source: Public Records
Map
Nearby Homes
- 896 Long Leaf Rd
- 409 Princeton Dr
- BELFORT Plan at Hartmann Crossing
- ARIA Plan at Hartmann Crossing
- CALI Plan at Hartmann Crossing
- HAYDEN Plan at Hartmann Crossing
- EDMON Plan at Hartmann Crossing
- 11 Hartmann Crossing Ct
- 13 Hartmann Crossing Ct
- 12 Hartmann Crossing Ct
- 212 Princeton Dr
- 826 Long Leaf Rd
- 14 Hartmann Crossing Ct
- 1509 Dove Dr
- 114 Hartmann Crossing Dr
- 5042 Hunters Village Dr
- 205 Princeton Dr
- 201 Hart Ln
- 204 Princeton Dr
- 5047 Hunters Village Dr