Estimated Value: $1,990,000 - $2,095,000
4
Beds
4
Baths
3,619
Sq Ft
$561/Sq Ft
Est. Value
About This Home
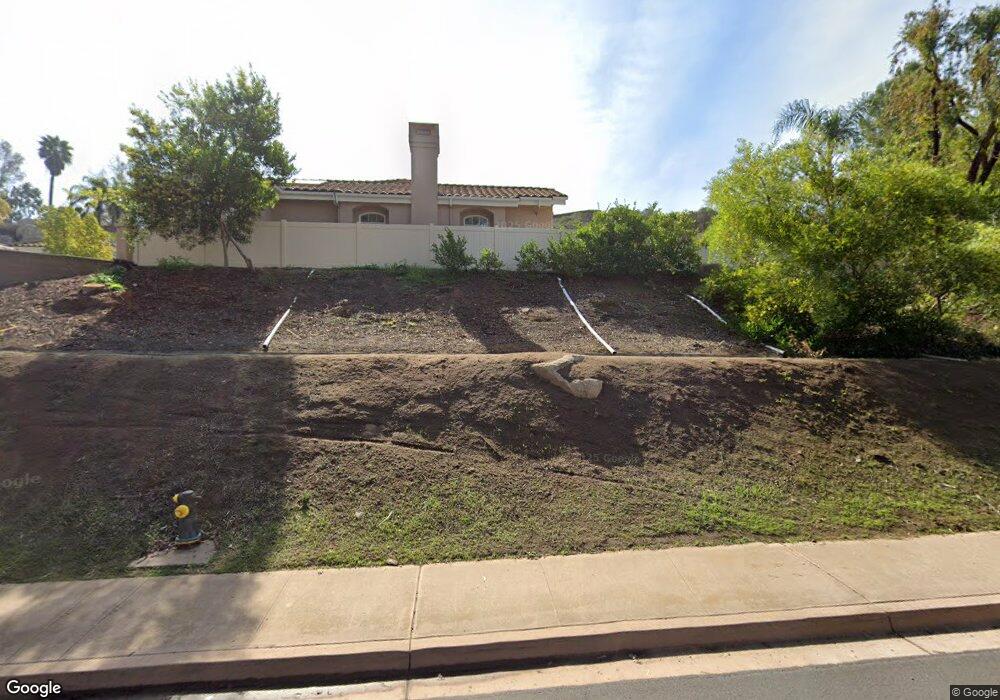
This home is located at 13185 Stone Canyon Rd, Poway, CA 92064 and is currently estimated at $2,029,089, approximately $560 per square foot. 13185 Stone Canyon Rd is a home located in San Diego County with nearby schools including Painted Rock Elementary, Twin Peaks Middle, and Poway High.
Ownership History
Date
Name
Owned For
Owner Type
Purchase Details
Closed on
Jun 13, 2013
Sold by
Baxter Jones Rosalyn P
Bought by
Osuch Lawrence T and Osuch Dana Lee J
Current Estimated Value
Home Financials for this Owner
Home Financials are based on the most recent Mortgage that was taken out on this home.
Original Mortgage
$635,000
Outstanding Balance
$454,308
Interest Rate
3.62%
Mortgage Type
Adjustable Rate Mortgage/ARM
Estimated Equity
$1,574,781
Purchase Details
Closed on
Nov 3, 2009
Sold by
Jones Napoleon A
Bought by
Jones Lena L and Baxter Jones Rosalyn P
Purchase Details
Closed on
Aug 8, 2009
Sold by
Jones Napoleon A
Bought by
Jones Napoleon A
Purchase Details
Closed on
Aug 9, 2001
Sold by
Baxter Jones Rosalyn P
Bought by
Jones Napoleon A
Home Financials for this Owner
Home Financials are based on the most recent Mortgage that was taken out on this home.
Original Mortgage
$290,000
Interest Rate
7%
Mortgage Type
Credit Line Revolving
Purchase Details
Closed on
Aug 14, 1991
Create a Home Valuation Report for This Property
The Home Valuation Report is an in-depth analysis detailing your home's value as well as a comparison with similar homes in the area
Home Values in the Area
Average Home Value in this Area
Purchase History
| Date | Buyer | Sale Price | Title Company |
|---|---|---|---|
| Osuch Lawrence T | $924,000 | California Title Company | |
| Jones Lena L | -- | None Available | |
| Jones Napoleon A | -- | None Available | |
| Jones Napoleon A | -- | First American Title | |
| -- | $650,000 | -- |
Source: Public Records
Mortgage History
| Date | Status | Borrower | Loan Amount |
|---|---|---|---|
| Open | Osuch Lawrence T | $635,000 | |
| Previous Owner | Jones Napoleon A | $290,000 |
Source: Public Records
Tax History
| Year | Tax Paid | Tax Assessment Tax Assessment Total Assessment is a certain percentage of the fair market value that is determined by local assessors to be the total taxable value of land and additions on the property. | Land | Improvement |
|---|---|---|---|---|
| 2025 | $5,969 | $541,195 | $203,641 | $337,554 |
| 2024 | $5,969 | $530,585 | $199,649 | $330,936 |
| 2023 | $5,842 | $520,183 | $195,735 | $324,448 |
| 2022 | $5,744 | $509,985 | $191,898 | $318,087 |
| 2021 | $5,669 | $499,986 | $188,136 | $311,850 |
| 2020 | $5,592 | $494,860 | $186,207 | $308,653 |
| 2019 | $5,447 | $485,157 | $182,556 | $302,601 |
| 2018 | $5,294 | $475,645 | $178,977 | $296,668 |
| 2017 | $5,153 | $466,319 | $175,468 | $290,851 |
| 2016 | $5,046 | $457,177 | $172,028 | $285,149 |
| 2015 | $4,971 | $450,310 | $169,444 | $280,866 |
| 2014 | $4,854 | $441,490 | $166,125 | $275,365 |
Source: Public Records
Map
Nearby Homes
- 13311 Fallen Leaf Rd
- 16405 Bronco Ln
- 16462 Martincoit Rd
- 15943 Ranch Hollow Rd
- 12526 Boulder Mountain Rd Unit 1,2,3
- 13678 Orchard Gate Rd
- 13371 Summit Cir
- 13664 Jack Rabbit Rd
- 16407 Caminito Vecinos Unit 155
- 16511 Caminito Vecinos Unit 64
- 16413 Roca Dr
- 16533 Caminito Vecinos Unit 52
- 16566 Caminito Vecinos Unit 25
- 16566 Caminito Vecinos Unit 31
- 16555 Caminito Vecinos Unit 39
- 15913 Avenida Villaha Unit 42
- 12424 Nacido Dr Unit 17
- 12417 Pipo Rd
- 12782 Jardin Rd
- 16482 Roca Dr
- 13151 Stone Canyon Rd
- 13225 Stone Canyon Rd
- 13150 Stone Canyon Rd
- 13222 Stone Canyon Rd
- 13229 Stone Canyon Rd
- 13148 Wild Flower Ln
- 13169 Wild Flower Ln
- 13144 Stone Canyon Rd
- 13139 Silver Saddle Ln
- 13151 Silver Saddle Ln
- 13133 Silver Saddle Ln
- 13245 Stone Canyon Rd
- 13232 Stone Canyon Rd
- 13157 Silver Saddle Ln
- 13127 Silver Saddle Ln
- 13251 Stone Canyon Rd
- 13138 Stone Canyon Rd
- 13201 Silver Saddle Ln
- 16080 Stoney Acres Rd
- 13121 Silver Saddle Ln
Your Personal Tour Guide
Ask me questions while you tour the home.