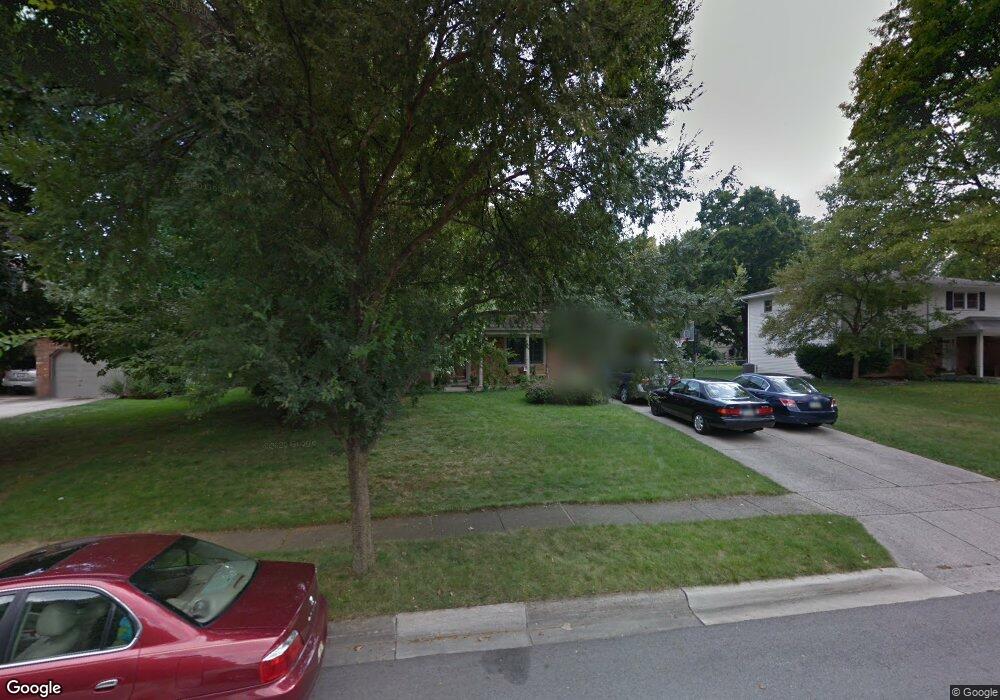
1319 Castleton Rd N Columbus, OH 43220
Estimated Value: $612,816 - $707,000
4
Beds
3
Baths
2,035
Sq Ft
$315/Sq Ft
Est. Value
About This Home
This home is located at 1319 Castleton Rd N, Columbus, OH 43220 and is currently estimated at $641,454, approximately $315 per square foot. 1319 Castleton Rd N is a home located in Franklin County with nearby schools including Greensview Elementary School, Hastings Middle School, and Upper Arlington High School.
Ownership History
Date
Name
Owned For
Owner Type
Purchase Details
Closed on
Apr 17, 1998
Sold by
Smith Ronald R and Smith Kathleen E
Bought by
Clark Scott L and Clark Margaret Molli
Current Estimated Value
Purchase Details
Closed on
Aug 25, 1997
Sold by
Baker Roger P and Estate Of Raymond C Baker
Bought by
Smith Ronald R and Smith Kathleen E
Home Financials for this Owner
Home Financials are based on the most recent Mortgage that was taken out on this home.
Original Mortgage
$145,000
Interest Rate
7.55%
Create a Home Valuation Report for This Property
The Home Valuation Report is an in-depth analysis detailing your home's value as well as a comparison with similar homes in the area
Home Values in the Area
Average Home Value in this Area
Purchase History
| Date | Buyer | Sale Price | Title Company |
|---|---|---|---|
| Clark Scott L | $195,000 | Title First Agency | |
| Smith Ronald R | $194,000 | Title First Agency Inc |
Source: Public Records
Mortgage History
| Date | Status | Borrower | Loan Amount |
|---|---|---|---|
| Closed | Smith Ronald R | $145,000 |
Source: Public Records
Tax History
| Year | Tax Paid | Tax Assessment Tax Assessment Total Assessment is a certain percentage of the fair market value that is determined by local assessors to be the total taxable value of land and additions on the property. | Land | Improvement |
|---|---|---|---|---|
| 2025 | $11,151 | $192,610 | $88,270 | $104,340 |
| 2024 | $11,151 | $192,610 | $88,270 | $104,340 |
| 2023 | $11,013 | $192,610 | $88,270 | $104,340 |
| 2022 | $9,649 | $138,080 | $51,030 | $87,050 |
| 2021 | $8,541 | $138,080 | $51,030 | $87,050 |
| 2020 | $8,466 | $138,080 | $51,030 | $87,050 |
| 2019 | $8,247 | $118,930 | $51,030 | $67,900 |
| 2018 | $7,672 | $118,930 | $51,030 | $67,900 |
| 2017 | $7,667 | $118,930 | $51,030 | $67,900 |
| 2016 | $7,151 | $108,150 | $31,220 | $76,930 |
| 2015 | $7,145 | $108,150 | $31,220 | $76,930 |
| 2014 | $7,153 | $108,150 | $31,220 | $76,930 |
| 2013 | $3,416 | $98,315 | $28,385 | $69,930 |
Source: Public Records
Map
Nearby Homes
- 1435 Havencrest Ct
- 4305 Castleton Rd
- 1594 Lafayette Dr Unit 1594
- 1605 Lafayette Dr Unit 1605
- 4818 Winterset Dr Unit 820
- 4692 Charecote Ln Unit E
- 1094 Merrimar Cir S Unit A
- 4710 Charecote Ln Unit D
- 1022 Galliton Ct Unit D
- 1466 Weybridge Rd
- 1046 Merrimar Cir N Unit B
- 1090 Woodmere Rd
- 4803 Wynwood Ct
- 1030 Galliton Ct Unit H
- 1701 Moreland Dr
- 1196 Francisco Rd
- 1165 Highland Dr
- 1239 Bradshire Dr
- 1234 Bradshire Dr
- 1242 Bradshire Dr
- 1329 Castleton Rd N
- 1307 Castleton Rd N
- 1316 Norwell Dr
- 1328 Norwell Dr
- 1339 N Castleton Rd
- 1339 Castleton Rd N
- 1304 Norwell Dr
- 1320 Castleton Rd N
- 1340 Norwell Dr
- 1308 Castleton Rd N
- 1290 Norwell Dr
- 1296 Castleton Rd N
- 1351 Castleton Rd N
- 1340 Castleton Rd N
- 1350 Norwell Dr
- 1283 Castleton Rd N
- 1283 N Castleton Rd
- 1278 Norwell Dr
- 1286 Castleton Rd N
- 4483 Reymond Ct
Your Personal Tour Guide
Ask me questions while you tour the home.