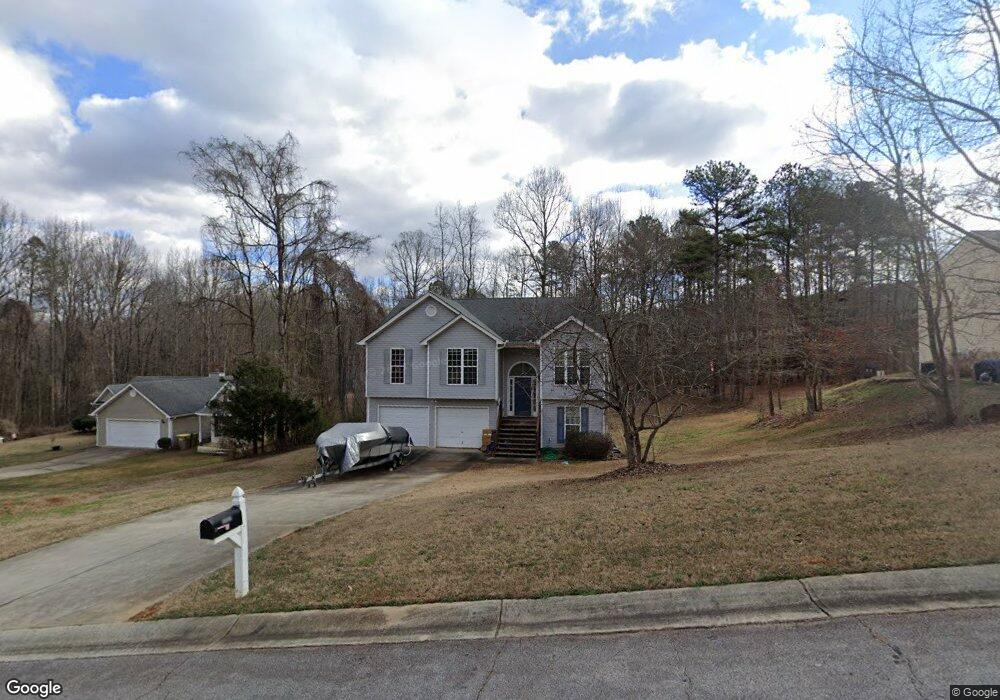
1319 Manning Way Monroe, GA 30656
Estimated Value: $276,172 - $341,000
--
Bed
2
Baths
1,548
Sq Ft
$204/Sq Ft
Est. Value
About This Home
This home is located at 1319 Manning Way, Monroe, GA 30656 and is currently estimated at $315,293, approximately $203 per square foot. 1319 Manning Way is a home located in Barrow County with nearby schools including Bethlehem Elementary School, Haymon-Morris Middle School, and Apalachee High School.
Ownership History
Date
Name
Owned For
Owner Type
Purchase Details
Closed on
Jul 11, 2024
Sold by
Maurer Nicholas B
Bought by
Maurer Nicholas B
Current Estimated Value
Home Financials for this Owner
Home Financials are based on the most recent Mortgage that was taken out on this home.
Original Mortgage
$50,000
Outstanding Balance
$49,398
Interest Rate
6.95%
Mortgage Type
New Conventional
Estimated Equity
$265,895
Purchase Details
Closed on
Jun 24, 2004
Sold by
Maurer Nicholas B
Bought by
Maurer Nicholas B and Maurer Petra
Home Financials for this Owner
Home Financials are based on the most recent Mortgage that was taken out on this home.
Original Mortgage
$132,950
Interest Rate
6.25%
Mortgage Type
VA
Purchase Details
Closed on
Feb 2, 2004
Sold by
Millstone Development Group In
Bought by
Clack Construction Llc
Purchase Details
Closed on
Feb 28, 2002
Bought by
Millstone Development Group Inc
Create a Home Valuation Report for This Property
The Home Valuation Report is an in-depth analysis detailing your home's value as well as a comparison with similar homes in the area
Home Values in the Area
Average Home Value in this Area
Purchase History
| Date | Buyer | Sale Price | Title Company |
|---|---|---|---|
| Maurer Nicholas B | -- | -- | |
| Maurer Nicholas B | -- | -- | |
| Maurer Nicholas B | $134,100 | -- | |
| Clack Construction Llc | $34,500 | -- | |
| Millstone Development Group Inc | -- | -- |
Source: Public Records
Mortgage History
| Date | Status | Borrower | Loan Amount |
|---|---|---|---|
| Open | Maurer Nicholas B | $50,000 | |
| Previous Owner | Maurer Nicholas B | $132,950 |
Source: Public Records
Tax History Compared to Growth
Tax History
| Year | Tax Paid | Tax Assessment Tax Assessment Total Assessment is a certain percentage of the fair market value that is determined by local assessors to be the total taxable value of land and additions on the property. | Land | Improvement |
|---|---|---|---|---|
| 2024 | $2,189 | $98,555 | $23,200 | $75,355 |
| 2023 | $2,483 | $98,555 | $23,200 | $75,355 |
| 2022 | $2,162 | $83,674 | $19,600 | $64,074 |
| 2021 | $1,857 | $66,497 | $14,000 | $52,497 |
| 2020 | $1,798 | $64,097 | $11,600 | $52,497 |
| 2019 | $1,735 | $60,238 | $11,600 | $48,638 |
| 2018 | $1,620 | $56,379 | $11,600 | $44,779 |
| 2017 | $1,289 | $44,267 | $9,600 | $34,667 |
| 2016 | $1,141 | $40,132 | $9,600 | $30,532 |
| 2015 | $1,156 | $40,467 | $9,600 | $30,867 |
| 2014 | $1,090 | $38,062 | $6,860 | $31,202 |
| 2013 | -- | $36,528 | $6,860 | $29,668 |
Source: Public Records
Map
Nearby Homes
- 1317 Manning Way Unit Lot 16
- 1317 Manning Way
- 1313 Manning Way
- 1323 Manning Way
- 1315 Manning Way
- 1404 Gin Mill Ct
- 1402 Gin Mill Ct
- 1313 Manning Way Unit 18
- 1313 Manning Way
- 1320 Manning Way Unit Lot 11
- 1320 Manning Way
- 1318 Manning Way
- 470 Gin Mill Dr Unit 21
- 470 Gin Mill Dr
- 472 Gin Mill Dr
- 1322 Manning Way Unit Lot 12
- 1322 Manning Way
- 1316 Manning Way
- 1407 Gin Mill Ct
- 466 Gin Mill Dr