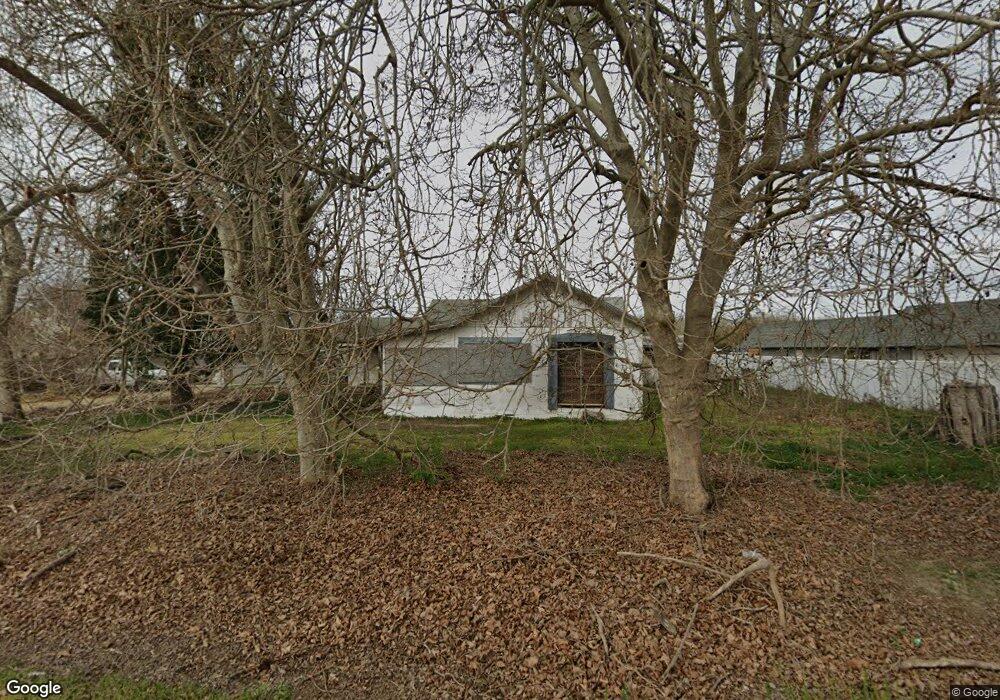
1319 S Verduga Rd Turlock, CA 95380
Estimated Value: $356,452 - $638,000
7
Beds
3
Baths
3,056
Sq Ft
$162/Sq Ft
Est. Value
About This Home
This home is located at 1319 S Verduga Rd, Turlock, CA 95380 and is currently estimated at $495,113, approximately $162 per square foot. 1319 S Verduga Rd is a home located in Stanislaus County with nearby schools including Julien Elementary School, Marvin A. Dutcher Middle School, and Turlock Junior High School.
Ownership History
Date
Name
Owned For
Owner Type
Purchase Details
Closed on
Sep 30, 2025
Sold by
Souza Michael A
Bought by
Souza Family 2025 Revocable Trust and Souza
Current Estimated Value
Purchase Details
Closed on
Jul 14, 1998
Sold by
Souza Judy M
Bought by
Souza Michael A
Purchase Details
Closed on
Jul 10, 1998
Sold by
The Bank Of New York
Bought by
Souza Michael A
Purchase Details
Closed on
Nov 11, 1997
Sold by
Richards Vicky Ann
Bought by
Amresco Residential Securities Corp
Purchase Details
Closed on
May 11, 1995
Sold by
Elliott Lawrence Merton
Bought by
Richards Vicky Ann
Home Financials for this Owner
Home Financials are based on the most recent Mortgage that was taken out on this home.
Original Mortgage
$84,000
Interest Rate
9%
Create a Home Valuation Report for This Property
The Home Valuation Report is an in-depth analysis detailing your home's value as well as a comparison with similar homes in the area
Home Values in the Area
Average Home Value in this Area
Purchase History
| Date | Buyer | Sale Price | Title Company |
|---|---|---|---|
| Souza Family 2025 Revocable Trust | -- | None Listed On Document | |
| Souza Michael A | -- | Fidelity National Title Co | |
| Souza Michael A | $76,500 | Fidelity National Title Co | |
| Amresco Residential Securities Corp | $55,000 | Fidelity National Title Ins | |
| Richards Vicky Ann | -- | Fidelity National Title Ins |
Source: Public Records
Mortgage History
| Date | Status | Borrower | Loan Amount |
|---|---|---|---|
| Previous Owner | Richards Vicky Ann | $84,000 |
Source: Public Records
Tax History Compared to Growth
Tax History
| Year | Tax Paid | Tax Assessment Tax Assessment Total Assessment is a certain percentage of the fair market value that is determined by local assessors to be the total taxable value of land and additions on the property. | Land | Improvement |
|---|---|---|---|---|
| 2025 | $1,507 | $142,509 | $78,375 | $64,134 |
| 2024 | $1,479 | $139,716 | $76,839 | $62,877 |
| 2023 | $1,475 | $136,978 | $75,333 | $61,645 |
| 2022 | $1,455 | $134,293 | $73,856 | $60,437 |
| 2021 | $1,433 | $131,660 | $72,408 | $59,252 |
| 2020 | $1,423 | $130,311 | $71,666 | $58,645 |
| 2019 | $1,399 | $127,757 | $70,261 | $57,496 |
| 2018 | $1,396 | $125,253 | $68,884 | $56,369 |
| 2017 | $1,363 | $122,798 | $67,534 | $55,264 |
| 2016 | $1,275 | $120,391 | $66,210 | $54,181 |
| 2015 | $1,263 | $118,584 | $65,216 | $53,368 |
| 2014 | $1,253 | $116,262 | $63,939 | $52,323 |
Source: Public Records
Map
Nearby Homes
- 2607 E Linwood Ave
- 1909 E Linwood Ave
- 2676 Oppelt Way
- 0 E Linwood Ave
- 2901 Youngstown Rd
- 2500 E Marshall St
- 11881 Griffith Rd
- 716 N Daubenberger Rd
- 1820 Julep Way
- 1412 E Glenwood Ave
- 1990 E Marshall St
- 1598 East Ave
- 277 Bothun Rd
- 925 S Rose St
- 444 Quarto Dr
- 439 Quarto Dr
- 1119 N Verduga Rd
- The Cameo Plan at Fifth Edition
- The Aspire Plan at Fifth Edition
- The Palermo Plan at Fifth Edition
- 1331 S Verduga Rd
- 1301 S Verduga Rd
- 1401 S Verduga Rd
- 1206 S Verduga Rd
- 1131 S Verduga Rd
- 1501 S Verduga Rd
- 1118 S Verduga Rd
- 3600 E Linwood Ave
- 3301 E Linwood Ave
- 3424 E Linwood Ave
- 3318 E Linwood Ave
- 931 S Verduga Rd
- 3300 E Linwood Ave
- 3113 E Linwood Ave
- 3224 E Linwood Ave
- 3900 E Linwood Ave
- 3200 E Linwood Ave
- 3931 E Linwood Ave
- 825 S Verduga Rd
- 3924 E Linwood Ave