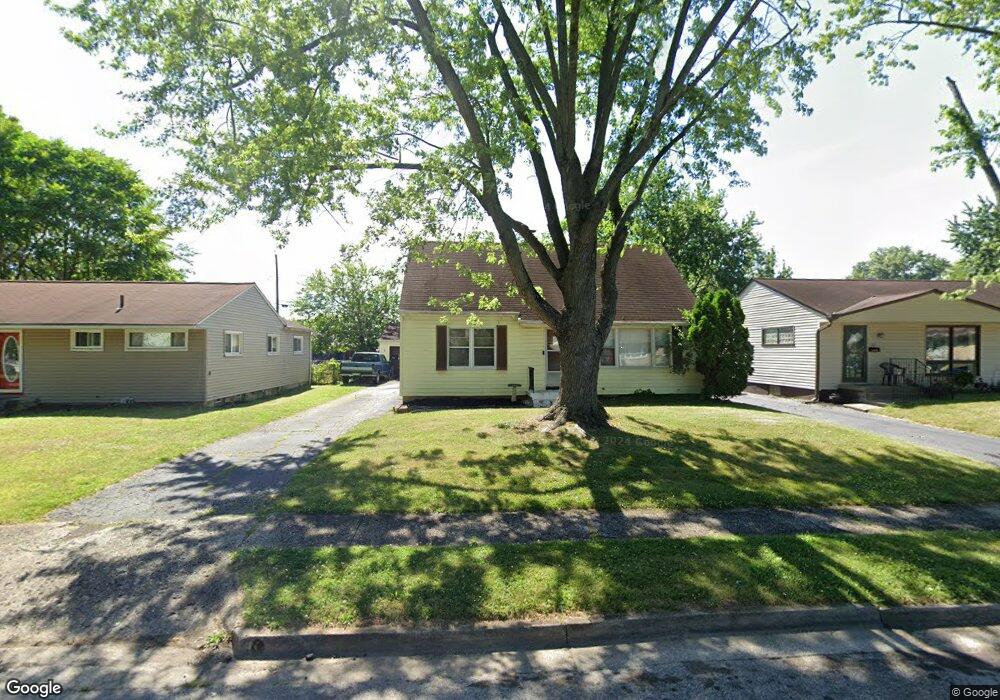
1319 S Weyant Ave Columbus, OH 43227
Linwood NeighborhoodEstimated Value: $220,701 - $248,000
3
Beds
2
Baths
1,530
Sq Ft
$155/Sq Ft
Est. Value
About This Home
This home is located at 1319 S Weyant Ave, Columbus, OH 43227 and is currently estimated at $236,675, approximately $154 per square foot. 1319 S Weyant Ave is a home located in Franklin County with nearby schools including Scottwood Elementary School, Johnson Park Middle School, and Walnut Ridge High School.
Ownership History
Date
Name
Owned For
Owner Type
Purchase Details
Closed on
Apr 17, 2008
Sold by
Hud
Bought by
Galloway Garlin
Current Estimated Value
Home Financials for this Owner
Home Financials are based on the most recent Mortgage that was taken out on this home.
Original Mortgage
$47,603
Outstanding Balance
$30,468
Interest Rate
6.17%
Mortgage Type
FHA
Estimated Equity
$206,207
Purchase Details
Closed on
Feb 7, 2007
Sold by
Cook Shirita Y and Wells Fargo Bank Na
Bought by
Hud
Purchase Details
Closed on
Feb 16, 2000
Sold by
Diehl Beatrice E
Bought by
Cook Shirita Y
Home Financials for this Owner
Home Financials are based on the most recent Mortgage that was taken out on this home.
Original Mortgage
$90,450
Interest Rate
8.16%
Mortgage Type
FHA
Purchase Details
Closed on
Aug 24, 1999
Sold by
Estate Of Leo F Diehl
Bought by
Diehl Beaurice E
Create a Home Valuation Report for This Property
The Home Valuation Report is an in-depth analysis detailing your home's value as well as a comparison with similar homes in the area
Home Values in the Area
Average Home Value in this Area
Purchase History
| Date | Buyer | Sale Price | Title Company |
|---|---|---|---|
| Galloway Garlin | $47,000 | Lakeside Ti | |
| Hud | $100,400 | None Available | |
| Cook Shirita Y | $83,000 | -- | |
| Diehl Beaurice E | -- | -- |
Source: Public Records
Mortgage History
| Date | Status | Borrower | Loan Amount |
|---|---|---|---|
| Open | Galloway Garlin | $47,603 | |
| Previous Owner | Cook Shirita Y | $90,450 |
Source: Public Records
Tax History Compared to Growth
Tax History
| Year | Tax Paid | Tax Assessment Tax Assessment Total Assessment is a certain percentage of the fair market value that is determined by local assessors to be the total taxable value of land and additions on the property. | Land | Improvement |
|---|---|---|---|---|
| 2024 | $2,673 | $59,570 | $13,230 | $46,340 |
| 2023 | $2,639 | $59,570 | $13,230 | $46,340 |
| 2022 | $2,104 | $26,570 | $6,720 | $19,850 |
| 2021 | $1,381 | $26,570 | $6,720 | $19,850 |
| 2020 | $1,382 | $26,570 | $6,720 | $19,850 |
| 2019 | $1,306 | $21,530 | $5,600 | $15,930 |
| 2018 | $1,323 | $21,530 | $5,600 | $15,930 |
| 2017 | $1,305 | $21,530 | $5,600 | $15,930 |
| 2016 | $1,479 | $22,330 | $4,830 | $17,500 |
| 2015 | $1,331 | $22,330 | $4,830 | $17,500 |
| 2014 | $1,346 | $22,330 | $4,830 | $17,500 |
| 2013 | $738 | $24,815 | $5,355 | $19,460 |
Source: Public Records
Map
Nearby Homes
- 1271 S Weyant Ave
- 3084 Clermont Rd
- 3325 Towers Ct S
- 1054 S Hampton Rd
- 3314 Towers Ct S
- 3353 Towers Ct S
- 3339 Towers Ct N
- 1077-1079 S James Rd
- 1048 S James Rd
- 1624 Miltwood Rd
- 3566 Seabrook Ave
- 3031 Janwood Dr
- 3563 Astor Ave
- 891 S Weyant Ave Unit 893
- 3246 E Deshler Ave
- 1664 Barnett Rd
- 2903 Scottwood Rd
- 3598 Astor Ave
- 864 S Waverly St
- 892 Ruby Ave
- 1325 S Weyant Ave
- 1311 S Weyant Ave
- 1333 S Weyant Ave
- 1305 S Weyant Ave
- 1312 Zettler Rd
- 1320 Zettler Rd
- 1306 Zettler Rd
- 1328 Zettler Rd
- 1298 Zettler Rd
- 1339 S Weyant Ave
- 1297 S Weyant Ave
- 1328 S Weyant Ave
- 1336 S Weyant Ave
- 1334 Zettler Rd
- 1292 Zettler Rd
- 1308 S Weyant Ave
- 1347 S Weyant Ave
- 1291 S Weyant Ave
- 1342 S Weyant Ave
- 1302 S Weyant Ave