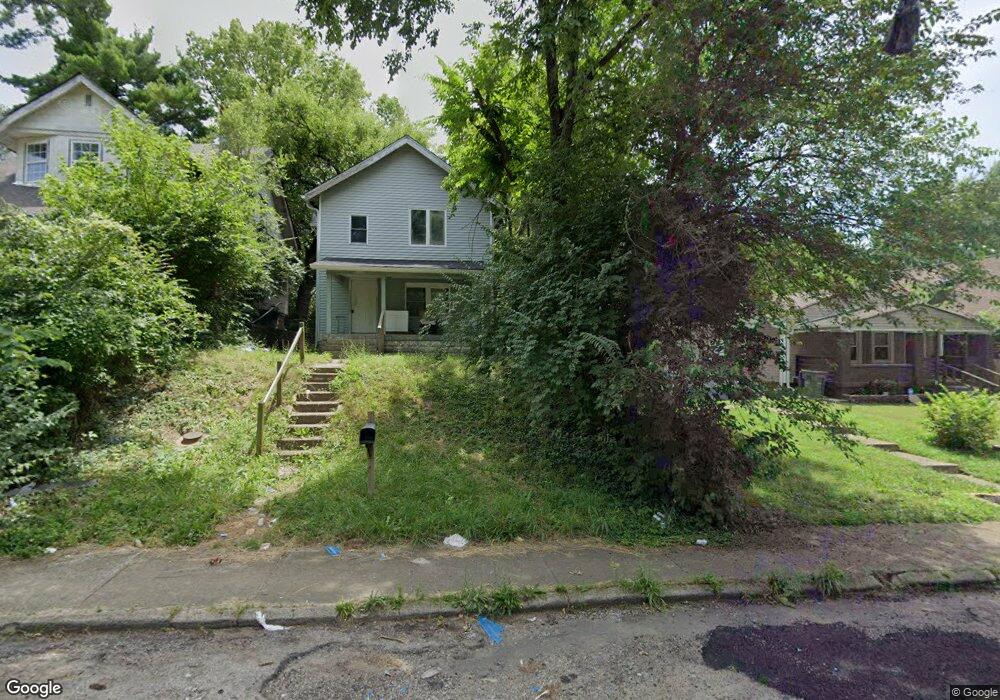
1319 W 34th St Indianapolis, IN 46208
Near Northwest Riverside NeighborhoodEstimated Value: $132,000 - $195,000
3
Beds
1
Bath
2,016
Sq Ft
$81/Sq Ft
Est. Value
About This Home
This home is located at 1319 W 34th St, Indianapolis, IN 46208 and is currently estimated at $163,095, approximately $80 per square foot. 1319 W 34th St is a home located in Marion County with nearby schools including Elder W. Diggs School 42, James Whitcomb Riley School 43, and Carl Wilde School 79.
Ownership History
Date
Name
Owned For
Owner Type
Purchase Details
Closed on
Apr 29, 2021
Sold by
Marion County Sheriff
Bought by
Wong Ventures Llc
Current Estimated Value
Purchase Details
Closed on
Nov 30, 2015
Sold by
All American Home Llc
Bought by
Horizon Trust Company and Daniel Fisher Ira
Purchase Details
Closed on
Nov 25, 2015
Sold by
Mt Helix Acquisitions I Llc
Bought by
All American Home Llc
Purchase Details
Closed on
Mar 28, 2013
Sold by
Brown President Ed
Bought by
Wilson Member Joe
Purchase Details
Closed on
Nov 16, 2012
Sold by
City Of Indianapolis Dmd
Bought by
Sombody Incorporated
Purchase Details
Closed on
Mar 17, 2011
Sold by
Transhire Holding Group Llc
Bought by
City Of Indianapolis
Purchase Details
Closed on
Jul 15, 2009
Sold by
Vf Tax Llc
Bought by
Transhire Holding Group Llc
Purchase Details
Closed on
Apr 11, 2007
Sold by
Marion County
Bought by
Vf Tax Llc
Create a Home Valuation Report for This Property
The Home Valuation Report is an in-depth analysis detailing your home's value as well as a comparison with similar homes in the area
Home Values in the Area
Average Home Value in this Area
Purchase History
| Date | Buyer | Sale Price | Title Company |
|---|---|---|---|
| Wong Ventures Llc | $153,001 | None Available | |
| Horizon Trust Company | -- | None Available | |
| All American Home Llc | -- | None Available | |
| Wilson Member Joe | $5,500 | -- | |
| Mt Helix Acquisitions I Llc | -- | -- | |
| Somebody Incorporated | -- | -- | |
| Sombody Incorporated | $1,000 | -- | |
| City Of Indianapolis | $3,688 | None Available | |
| Transhire Holding Group Llc | -- | None Available | |
| Vf Tax Llc | $4,308 | None Available |
Source: Public Records
Tax History Compared to Growth
Tax History
| Year | Tax Paid | Tax Assessment Tax Assessment Total Assessment is a certain percentage of the fair market value that is determined by local assessors to be the total taxable value of land and additions on the property. | Land | Improvement |
|---|---|---|---|---|
| 2024 | $2,925 | $105,800 | $14,400 | $91,400 |
| 2023 | $2,925 | $119,600 | $14,400 | $105,200 |
| 2022 | $2,631 | $118,900 | $14,400 | $104,500 |
| 2021 | $1,646 | $67,700 | $3,300 | $64,400 |
| 2020 | $1,319 | $53,400 | $3,300 | $50,100 |
| 2019 | $1,157 | $45,600 | $3,300 | $42,300 |
| 2018 | $1,044 | $36,500 | $3,300 | $33,200 |
| 2017 | $708 | $29,700 | $3,300 | $26,400 |
| 2016 | $692 | $29,700 | $3,300 | $26,400 |
| 2014 | $121 | $5,600 | $3,300 | $2,300 |
| 2013 | $125 | $6,000 | $3,300 | $2,700 |
Source: Public Records
Map
Nearby Homes
- 1311 W 33rd St
- 1401 W 34th St
- 1343 W 33rd St
- 1340 W 32nd St
- 1229 W 33rd St
- 1410 W 35th St
- 1445 W 34th St
- 1263 W 32nd St
- 1207 W 35th St
- 1450 W 33rd St
- 3325 Elmira St
- 1459 W 33rd St
- 1149 W Congress Ave
- 1467 W 33rd St
- 1307 W Congress Ave
- 1141 W 35th St
- 1149 W 36th St
- 3220 River Villa Way
- 3106 N Harding St
- 1125 W Congress Ave