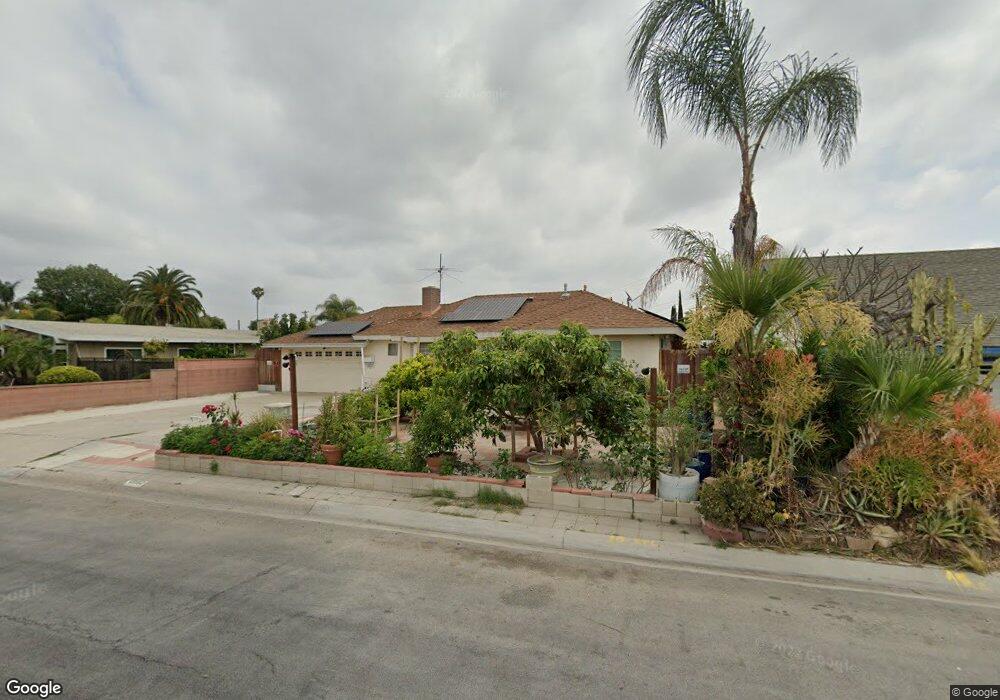
13192 Galway St Garden Grove, CA 92844
Estimated Value: $959,000 - $1,392,000
2
Beds
2
Baths
1,968
Sq Ft
$574/Sq Ft
Est. Value
About This Home
This home is located at 13192 Galway St, Garden Grove, CA 92844 and is currently estimated at $1,128,706, approximately $573 per square foot. 13192 Galway St is a home located in Orange County with nearby schools including Sunnyside Elementary School, Donald S. Jordan Intermediate School, and Bolsa Grande High School.
Ownership History
Date
Name
Owned For
Owner Type
Purchase Details
Closed on
Apr 2, 2008
Sold by
Dinh James Quang and Nguyen Michelle T
Bought by
Vanvanvo Den Van and Bui Hanh Kieu
Current Estimated Value
Home Financials for this Owner
Home Financials are based on the most recent Mortgage that was taken out on this home.
Original Mortgage
$348,000
Outstanding Balance
$221,247
Interest Rate
6.04%
Mortgage Type
Purchase Money Mortgage
Estimated Equity
$907,459
Purchase Details
Closed on
Jun 24, 2005
Sold by
Hauch Duane E
Bought by
Dinh James Ouang and Nguyen Michelle T
Home Financials for this Owner
Home Financials are based on the most recent Mortgage that was taken out on this home.
Original Mortgage
$424,000
Interest Rate
5.62%
Mortgage Type
Purchase Money Mortgage
Create a Home Valuation Report for This Property
The Home Valuation Report is an in-depth analysis detailing your home's value as well as a comparison with similar homes in the area
Home Values in the Area
Average Home Value in this Area
Purchase History
| Date | Buyer | Sale Price | Title Company |
|---|---|---|---|
| Vanvanvo Den Van | $435,000 | Ticor Title Tustin Orange Co | |
| Dinh James Ouang | $530,000 | Multiple |
Source: Public Records
Mortgage History
| Date | Status | Borrower | Loan Amount |
|---|---|---|---|
| Open | Vanvanvo Den Van | $348,000 | |
| Previous Owner | Dinh James Ouang | $424,000 |
Source: Public Records
Tax History Compared to Growth
Tax History
| Year | Tax Paid | Tax Assessment Tax Assessment Total Assessment is a certain percentage of the fair market value that is determined by local assessors to be the total taxable value of land and additions on the property. | Land | Improvement |
|---|---|---|---|---|
| 2025 | $7,941 | $657,908 | $467,466 | $190,442 |
| 2024 | $7,941 | $645,008 | $458,300 | $186,708 |
| 2023 | $7,795 | $632,361 | $449,313 | $183,048 |
| 2022 | $7,629 | $619,962 | $440,503 | $179,459 |
| 2021 | $7,547 | $607,806 | $431,865 | $175,941 |
| 2020 | $7,446 | $601,574 | $427,437 | $174,137 |
| 2019 | $7,300 | $589,779 | $419,056 | $170,723 |
| 2018 | $7,152 | $578,215 | $410,839 | $167,376 |
| 2017 | $7,052 | $566,878 | $402,783 | $164,095 |
| 2016 | $6,696 | $555,763 | $394,885 | $160,878 |
| 2015 | $6,100 | $503,790 | $354,087 | $149,703 |
| 2014 | $5,256 | $433,200 | $354,087 | $79,113 |
Source: Public Records
Map
Nearby Homes
- 9651 Crosby Ave
- 9691 Central Ave
- 13100 Gilbert St Unit 28
- 9370 W Garden Grove Blvd
- 9931 Central Ave
- 10002 Central Ave Unit 27
- 10002 Central Ave
- 13392 Magnolia St
- 10094 Larson Ave
- 12861 Alamitos Way
- 13411 Magnolia St
- 10361 Garden Grove Blvd Unit 30
- 8833 Brookdale Dr
- 10371 Garden Grove Blvd Unit 16
- 10371 Garden Grove Blvd Unit 20
- 13161 Adland St
- 10401 W Garden Grove Blvd Unit 53
- 13839 Magnolia St
- 10391 Mildred Ave
- 10181 Lampson Ave
- 13212 Galway St
- 13182 Galway St
- 9602 Crosby Ave
- 9581 Central Ave
- 9601 Central Ave
- 9612 Crosby Ave
- 13191 Galway St
- 13211 Galway St
- 9611 Central Ave
- 9581 Crosby Ave
- 13171 Galway St
- 9622 Crosby Ave
- 13231 Galway St
- 13161 Galway St
- 9621 Central Ave
- 9601 Crosby Ave
- 13252 Galway St
- 9611 Crosby Ave
- 9632 Crosby Ave
- 13151 Galway St