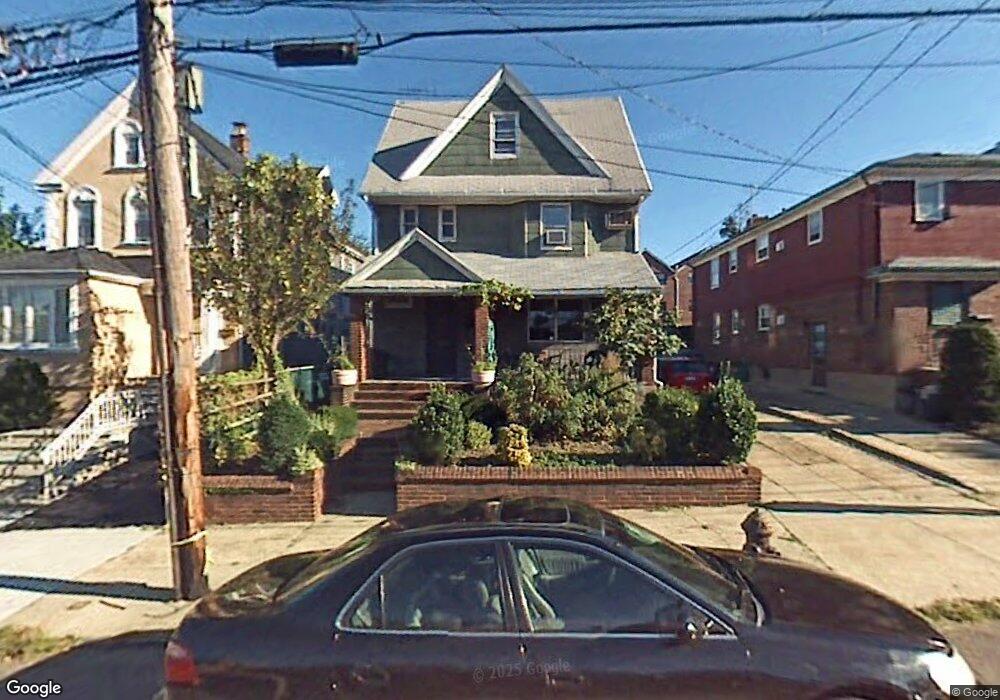
132-23 57th Rd Flushing, NY 11355
Flushing NeighborhoodEstimated Value: $1,408,515 - $1,880,000
6
Beds
4
Baths
2,581
Sq Ft
$623/Sq Ft
Est. Value
About This Home
This home is located at 132-23 57th Rd, Flushing, NY 11355 and is currently estimated at $1,607,129, approximately $622 per square foot. 132-23 57th Rd is a home located in Queens County with nearby schools including P.S. 120 - Queens, Rachel Carson I.S. 237Q, and John Bowne High School.
Ownership History
Date
Name
Owned For
Owner Type
Purchase Details
Closed on
May 1, 2021
Sold by
Yang Andy and Yang Xiu Hua
Bought by
Andy Yang and Andy Xiu Hua
Current Estimated Value
Purchase Details
Closed on
Jun 16, 2016
Sold by
Ciurleo Rosa and Ciurleo Rose
Bought by
Yang Andy and Yang Xiu Hua
Purchase Details
Closed on
Jun 28, 2006
Sold by
Ciurleo Rose and Pugliese Dominick
Bought by
Ciurleo Rosa and Pugliese Dominick
Purchase Details
Closed on
Feb 24, 2000
Sold by
Pugliese Salvatore and Pugliese Theresa
Bought by
Pugliese Dominick and Ciurleo Rose
Create a Home Valuation Report for This Property
The Home Valuation Report is an in-depth analysis detailing your home's value as well as a comparison with similar homes in the area
Home Values in the Area
Average Home Value in this Area
Purchase History
| Date | Buyer | Sale Price | Title Company |
|---|---|---|---|
| Andy Yang | -- | -- | |
| Andy Yang | -- | -- | |
| Yang Andy | $988,000 | -- | |
| Yang Andy | $988,000 | -- | |
| Yang Andy | $988,000 | -- | |
| Ciurleo Rosa | -- | -- | |
| Ciurleo Rosa | -- | -- | |
| Pugliese Dominick | -- | -- | |
| Pugliese Dominick | -- | -- |
Source: Public Records
Mortgage History
| Date | Status | Borrower | Loan Amount |
|---|---|---|---|
| Closed | Ciurleo Rosa | $0 |
Source: Public Records
Tax History
| Year | Tax Paid | Tax Assessment Tax Assessment Total Assessment is a certain percentage of the fair market value that is determined by local assessors to be the total taxable value of land and additions on the property. | Land | Improvement |
|---|---|---|---|---|
| 2025 | $7,996 | $42,200 | $8,242 | $33,958 |
| 2024 | $7,996 | $39,812 | $7,304 | $32,508 |
| 2023 | $7,996 | $39,812 | $6,471 | $33,341 |
| 2022 | $7,888 | $101,580 | $16,500 | $85,080 |
| 2021 | $7,845 | $85,920 | $16,500 | $69,420 |
| 2020 | $7,444 | $83,340 | $16,500 | $66,840 |
| 2019 | $6,940 | $80,940 | $16,500 | $64,440 |
| 2018 | $6,763 | $33,177 | $7,989 | $25,188 |
| 2017 | $6,712 | $32,926 | $9,155 | $23,771 |
| 2016 | $6,210 | $32,926 | $9,155 | $23,771 |
| 2015 | $3,746 | $29,306 | $9,737 | $19,569 |
| 2014 | $3,746 | $27,648 | $11,023 | $16,625 |
Source: Public Records
Map
Nearby Homes
- 13219 58th Ave
- 58-15 134th St
- 13437 58th Rd
- 5612 135th St
- 56-75 136th St Unit 3B
- 13620 Booth Memorial Ave Unit 2A
- 136-05 59th Ave
- 132-20 60th Ave
- 132-56 60th Ave
- 136-43 58th Rd
- 130-14 60th Ave Unit 2E
- 13450 Blossom Ave Unit 5E
- 13214 Horace Harding Expy
- 5804 Main St Unit 2D
- 132-29 Blossom Ave Unit 2G
- 134-05 Dahlia Ave Unit 5-3A
- 13229 Blossom Ave Unit 6
- 42-98 Saull St Unit 401
- 131-19 Fowler Ave Unit 5A
- 131-19 Fowler Ave Unit 1B
- 13223 57th Rd
- 13221 57th Rd
- 13229 57th Rd
- 13215 57th Rd
- 13231 57th Rd
- 13224 57th Ave
- 132-24 57th Ave
- 13235 57th Rd
- 13211 57th Rd
- 132-22 57th Ave Unit 2
- 132-22 57th Ave
- 13222 57th Ave
- 13228 57th Ave
- 132-28 57th Ave Unit 3-FLR
- 13218 57th Ave
- 13216 57th Ave
- 13230 57th Ave
- 13230 57th Ave Unit 2
- 132-30 57th Ave Unit 2 Fl
- 132-30 57th Ave Unit 2
Your Personal Tour Guide
Ask me questions while you tour the home.