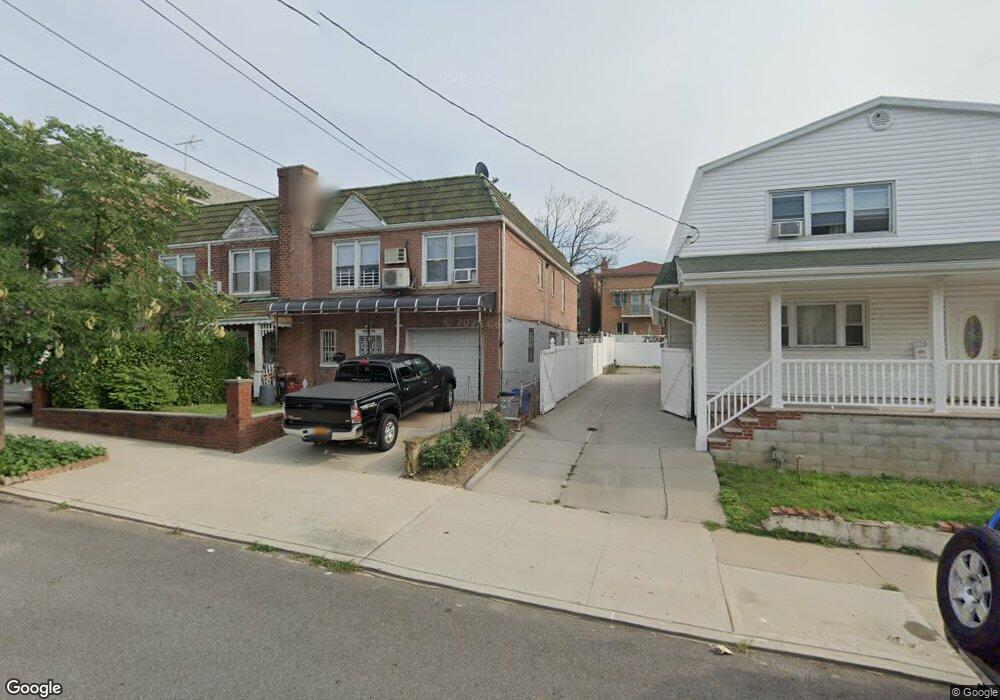
132-26 58th Ave Unit 2nd FL Flushing, NY 11355
Flushing NeighborhoodEstimated Value: $1,143,482 - $1,526,000
3
Beds
1
Bath
1,824
Sq Ft
$747/Sq Ft
Est. Value
About This Home
This home is located at 132-26 58th Ave Unit 2nd FL, Flushing, NY 11355 and is currently estimated at $1,362,371, approximately $746 per square foot. 132-26 58th Ave Unit 2nd FL is a home located in Queens County with nearby schools including P.S. 120 - Queens, Rachel Carson I.S. 237Q, and John Bowne High School.
Ownership History
Date
Name
Owned For
Owner Type
Purchase Details
Closed on
Apr 11, 2012
Sold by
Ng Sau Fan
Bought by
Xu Yun Pin
Current Estimated Value
Home Financials for this Owner
Home Financials are based on the most recent Mortgage that was taken out on this home.
Original Mortgage
$290,000
Outstanding Balance
$198,870
Interest Rate
3.91%
Mortgage Type
New Conventional
Estimated Equity
$1,163,501
Purchase Details
Closed on
Feb 18, 2005
Sold by
Dutan Luis and Dutan Maria
Bought by
Ng Sau Fan
Home Financials for this Owner
Home Financials are based on the most recent Mortgage that was taken out on this home.
Original Mortgage
$100,000
Interest Rate
5.66%
Mortgage Type
Purchase Money Mortgage
Purchase Details
Closed on
Jun 2, 2003
Sold by
Supino Toni-Ann
Bought by
Dutan Luis and Dutan Maria
Purchase Details
Closed on
Sep 9, 1997
Sold by
Jsupino Anthony and Supino Dorothy
Bought by
Supino Toni Ann and Anthony Supino Trust
Create a Home Valuation Report for This Property
The Home Valuation Report is an in-depth analysis detailing your home's value as well as a comparison with similar homes in the area
Home Values in the Area
Average Home Value in this Area
Purchase History
| Date | Buyer | Sale Price | Title Company |
|---|---|---|---|
| Xu Yun Pin | $668,000 | -- | |
| Xu Yun Pin | $668,000 | -- | |
| Ng Sau Fan | $449,000 | -- | |
| Ng Sau Fan | $449,000 | -- | |
| Dutan Luis | $435,000 | -- | |
| Dutan Luis | $435,000 | -- | |
| Supino Toni Ann | -- | -- | |
| Supino Toni Ann | -- | -- |
Source: Public Records
Mortgage History
| Date | Status | Borrower | Loan Amount |
|---|---|---|---|
| Open | Xu Yun Pin | $290,000 | |
| Closed | Xu Yun Pin | $290,000 | |
| Previous Owner | Ng Sau Fan | $100,000 | |
| Closed | Dutan Luis | $0 |
Source: Public Records
Tax History Compared to Growth
Tax History
| Year | Tax Paid | Tax Assessment Tax Assessment Total Assessment is a certain percentage of the fair market value that is determined by local assessors to be the total taxable value of land and additions on the property. | Land | Improvement |
|---|---|---|---|---|
| 2025 | $8,052 | $42,493 | $7,210 | $35,283 |
| 2024 | $8,052 | $40,090 | $7,638 | $32,452 |
| 2023 | $7,597 | $37,822 | $6,343 | $31,479 |
| 2022 | $6,767 | $64,680 | $13,020 | $51,660 |
| 2021 | $7,541 | $64,080 | $13,020 | $51,060 |
| 2020 | $7,493 | $70,440 | $13,020 | $57,420 |
| 2019 | $6,989 | $66,960 | $13,020 | $53,940 |
| 2018 | $6,425 | $31,518 | $7,102 | $24,416 |
| 2017 | $6,087 | $29,859 | $7,465 | $22,394 |
| 2016 | $5,969 | $29,859 | $7,465 | $22,394 |
| 2015 | $3,178 | $29,509 | $8,912 | $20,597 |
| 2014 | $3,178 | $27,840 | $8,910 | $18,930 |
Source: Public Records
Map
Nearby Homes
- 5739 134th St
- 13219 58th Ave
- 58-15 134th St
- 13420 57th Ave
- 13437 58th Rd
- 13403 59th Ave
- 136-20 Booth Memorial Ave Unit 3H
- 56-75 136th St Unit 3B
- 13620 Booth Memorial Ave Unit 2A
- 132-25 60th Ave
- 5612 135th St
- 132-56 60th Ave
- 132-20 60th Ave
- 136-43 58th Rd
- 13214 Horace Harding Expy
- 130-14 60th Ave Unit 2E
- 13713 56th Ave
- 58-04 Main St Unit 1A
- 5804 Main St Unit 2D
- 61-31 136th St
- 13226 58th Ave
- 13228 58th Ave
- 13220 58th Ave
- 13232 58th Ave
- 132-16 58th Ave
- 13216 58th Ave
- 13225 58th Rd
- 13221 58th Rd
- 13227 58th Rd
- 13221 58th Rd
- 13221 58th Rd Unit Fl 1
- 13236 58th Ave
- 13229 58th Rd
- 13217 58th Rd
- 13212 58th Ave
- 13231 58th Rd
- 13231 58th Rd
- 13215 58th Rd
- 13240 58th Ave Unit 2R
- 13240 58th Ave