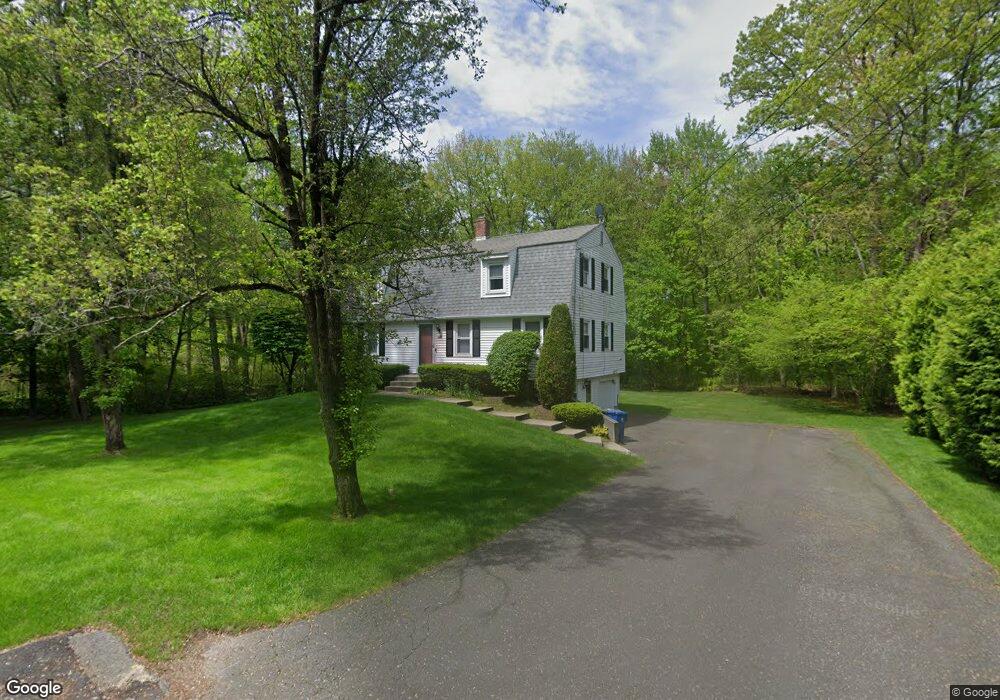
132 Autumn Rd West Springfield, MA 01089
Estimated Value: $404,000 - $471,000
4
Beds
2
Baths
1,728
Sq Ft
$251/Sq Ft
Est. Value
About This Home
This home is located at 132 Autumn Rd, West Springfield, MA 01089 and is currently estimated at $433,817, approximately $251 per square foot. 132 Autumn Rd is a home located in Hampden County with nearby schools including St Thomas The Apostle School.
Ownership History
Date
Name
Owned For
Owner Type
Purchase Details
Closed on
Jul 28, 1998
Sold by
Cerpovicz David M and Cerpovicz Leeann
Bought by
Ritucci Kenenth P
Current Estimated Value
Purchase Details
Closed on
Dec 23, 1992
Sold by
Germano Daniel F and Germano Laurene
Bought by
Cerpovicz David M and Cerpovicz Leeann
Purchase Details
Closed on
May 16, 1988
Sold by
Fox Gregory J
Bought by
Germano Daniel F
Create a Home Valuation Report for This Property
The Home Valuation Report is an in-depth analysis detailing your home's value as well as a comparison with similar homes in the area
Home Values in the Area
Average Home Value in this Area
Purchase History
| Date | Buyer | Sale Price | Title Company |
|---|---|---|---|
| Ritucci Kenenth P | $148,000 | -- | |
| Cerpovicz David M | $138,000 | -- | |
| Germano Daniel F | $175,000 | -- |
Source: Public Records
Mortgage History
| Date | Status | Borrower | Loan Amount |
|---|---|---|---|
| Open | Germano Daniel F | $50,000 | |
| Closed | Germano Daniel F | $20,800 | |
| Closed | Germano Daniel F | $25,000 |
Source: Public Records
Tax History Compared to Growth
Tax History
| Year | Tax Paid | Tax Assessment Tax Assessment Total Assessment is a certain percentage of the fair market value that is determined by local assessors to be the total taxable value of land and additions on the property. | Land | Improvement |
|---|---|---|---|---|
| 2025 | $5,133 | $345,200 | $126,000 | $219,200 |
| 2024 | $4,862 | $328,300 | $126,000 | $202,300 |
| 2023 | $4,690 | $301,800 | $126,000 | $175,800 |
| 2022 | $4,280 | $271,600 | $114,600 | $157,000 |
| 2021 | $4,294 | $254,100 | $108,900 | $145,200 |
| 2020 | $4,445 | $261,600 | $108,900 | $152,700 |
| 2019 | $4,437 | $261,600 | $108,900 | $152,700 |
| 2018 | $4,460 | $261,600 | $108,900 | $152,700 |
| 2017 | $4,460 | $261,600 | $108,900 | $152,700 |
| 2016 | $4,463 | $262,700 | $105,000 | $157,700 |
| 2015 | $4,375 | $257,500 | $102,900 | $154,600 |
| 2014 | $1,063 | $257,500 | $102,900 | $154,600 |
Source: Public Records
Map
Nearby Homes
- 61 Clarence St
- 81 Laurence Dr
- 65 Verdugo St
- 19 Cora St
- 16 North St
- 43 Wishing Well Way
- 42 Janet St
- 74 Maple Terrace
- 260 Wolcott Ave
- 36 Maple Terrace
- 147 Grandview Ave
- 42 Gregory Ln
- 31 Stone Path Ln
- 180 Wolcott Ave
- 36 Shady Brook
- 86 Birnie Ave
- 34 High Meadow Dr
- 32 Windpath E
- 30 Chestnut St
- 514 Dewey St