

About This Home
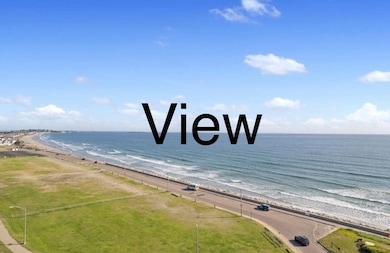
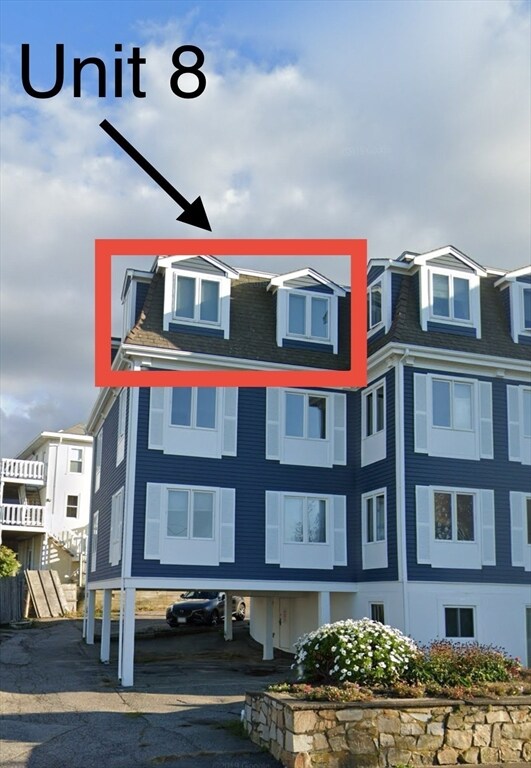
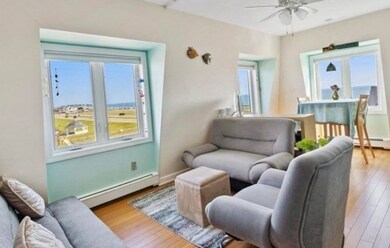
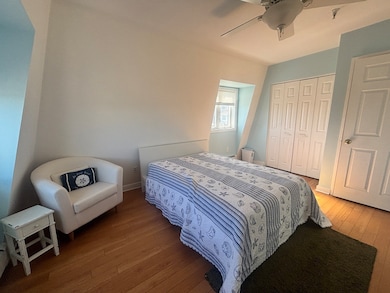
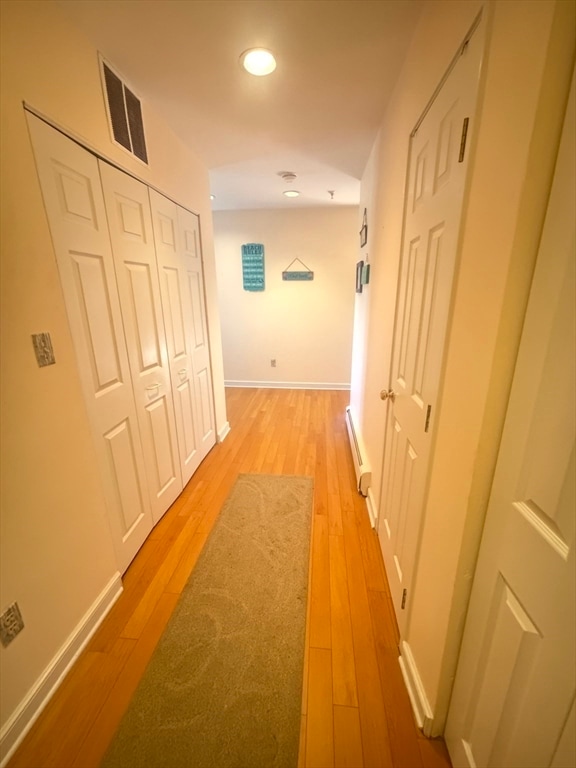
Ocean and bay views! Year-round 1 bed / 1 bath fully furnished rental available immediately. Top floor corner unit is updated with 'beachy' feel. Bright and sunny with unbeatable convenience to the beach, restaurants, shopping, parks and more! Plenty of closet space, in-unit laundry! One parking space available! No pets, no smoking. Tenant pays electricity and gas. References and excellent credit required.
Condo Details
Home Type
- Condominium
Est. Annual Taxes
- $2,783
Year Built
- Built in 1988
Parking
- 1 Car Parking Space
Home Design
- 670 Sq Ft Home
- Entry on the 4th floor
Bedrooms and Bathrooms
- 1 Bedroom
- 1 Full Bathroom
Additional Features
- Laundry in unit
- Waterfront
- No Cooling
Listing and Financial Details
- Rent includes water, sewer, trash collection, snow removal, gardener
- 12 Month Lease Term
- Assessor Parcel Number M:00033 P:00049H,1044781
Community Details
Overview
- No Home Owners Association
Pet Policy
- No Pets Allowed
Map
Source: MLS Property Information Network (MLS PIN)
MLS Number: 73455984
APN: HULL-000033-000000-000049-H000000
Disclaimer: Certain information contained herein is derived from information provided by parties other than Homes.com. All information provided is deemed reliable, but is not guaranteed to be accurate and should be independently verified.
![]() The property listing data and information, or the Images, set forth herein were provided to MLS Property Information Network, Inc. from third party sources, including sellers, lessors and public records, and were compiled by MLS Property Information Network, Inc. The property listing data and information, and the Images, are for the personal, non-commercial use of consumers having a good faith interest in purchasing or leasing listed properties of the type displayed to them and may not be used for any purpose other than to identify prospective properties which such consumers may have a good faith interest in purchasing or leasing. MLS Property Information Network, Inc. and its subscribers disclaim any and all representations and warranties as to the accuracy of the property listing data and information, or as to the accuracy of any of the Images, set forth herein.
The property listing data and information, or the Images, set forth herein were provided to MLS Property Information Network, Inc. from third party sources, including sellers, lessors and public records, and were compiled by MLS Property Information Network, Inc. The property listing data and information, and the Images, are for the personal, non-commercial use of consumers having a good faith interest in purchasing or leasing listed properties of the type displayed to them and may not be used for any purpose other than to identify prospective properties which such consumers may have a good faith interest in purchasing or leasing. MLS Property Information Network, Inc. and its subscribers disclaim any and all representations and warranties as to the accuracy of the property listing data and information, or as to the accuracy of any of the Images, set forth herein.
- 134 Hampton Cir
- 15 Lincoln Ave
- 14 Standish Rd
- 53 Mountford Rd
- 15 2nd St
- 67 Whitehead Ave
- 2 6th St
- 54 Salisbury St Waterfront
- 4 Atherton Rd
- 22 Berkley Rd Unit B
- 22 Berkley Rd Unit C
- 19 Berkley Rd
- 23 Bates St
- 20 Rockland House Rd Unit 203
- 105 Warfield Ave
- 31 Kenberma St
- 23 Wyola Rd
- 40 Oceanside Dr Unit 40
- 25 Oceanside Dr
- 62 Oceanside Dr
- 45 Hull Shore Dr Year Round Unit 110
- 4 Bay St Unit A-0
- 71 Bay St Unit B
- 49 Massasoit Ave Unit 2
- 540 Nantasket Ave Unit 2R
- 158 Newport Rd-1st Fl- Waterfront Unit 1
- 97A Beach Ave Winter Only Unit 9/1-6/30
- 35 Oceanside Dr
- 24 Warren Street July Or August Unit House
- 22 Oceanside Dr Unit 22
- 99 Unit in 12/15
- 6 Hadasah Way Winter Rental Unit 11/1-5/15
- 15 Packard Ave
- 1 Avalon Dr
- 30 Coburn St- Winter Rental
- 242 Atlantic Ave Unit 2
- 435 Newport Rd Unit 2
- 5 Adams St Winter Rental Unit 9/16-6/15
- 201 Samoset Ave Winter Rental
- 10 Ocean Ledge Dr
