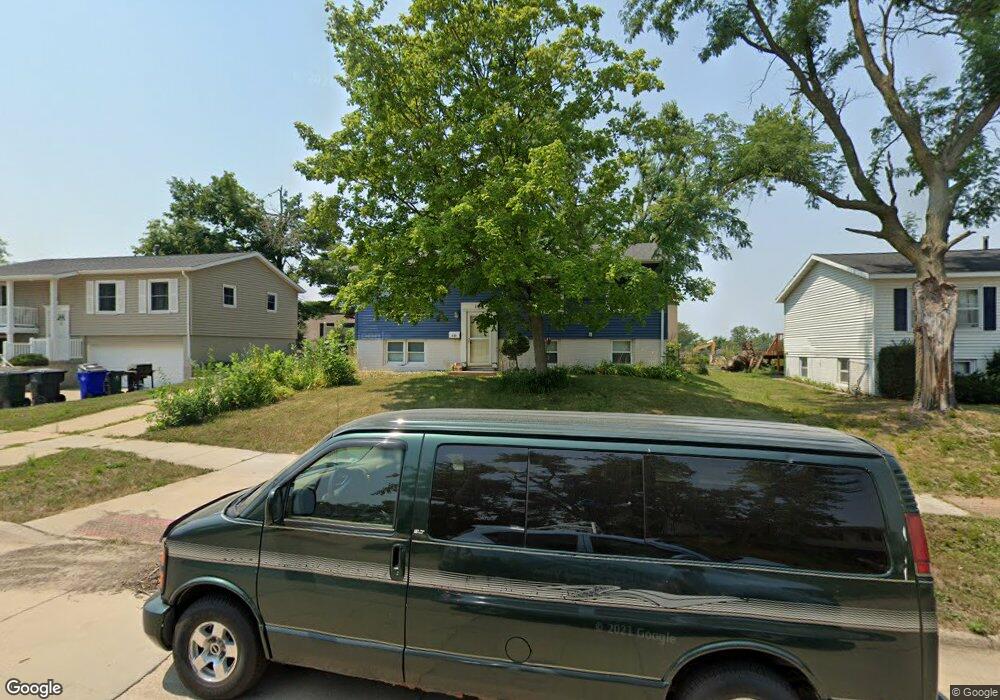
132 Broadmore Rd SW Cedar Rapids, IA 52404
Cherry Hill Park NeighborhoodEstimated Value: $205,785 - $230,000
5
Beds
2
Baths
1,001
Sq Ft
$216/Sq Ft
Est. Value
About This Home
This home is located at 132 Broadmore Rd SW, Cedar Rapids, IA 52404 and is currently estimated at $216,696, approximately $216 per square foot. 132 Broadmore Rd SW is a home located in Linn County with nearby schools including Junction City Elementary School, West Willow Elementary School, and Bourbon Central Elementary School.
Ownership History
Date
Name
Owned For
Owner Type
Purchase Details
Closed on
Nov 22, 2010
Sold by
Reed Amy B
Bought by
Reed Scot W
Current Estimated Value
Home Financials for this Owner
Home Financials are based on the most recent Mortgage that was taken out on this home.
Original Mortgage
$94,000
Outstanding Balance
$1,401
Interest Rate
4.19%
Mortgage Type
New Conventional
Estimated Equity
$215,295
Purchase Details
Closed on
Mar 27, 2007
Sold by
Hanson Robert J and Hanson Beverly A
Bought by
Reed Scot W and Reed Amy B
Home Financials for this Owner
Home Financials are based on the most recent Mortgage that was taken out on this home.
Original Mortgage
$99,200
Interest Rate
6.2%
Mortgage Type
Purchase Money Mortgage
Purchase Details
Closed on
Aug 23, 2006
Sold by
Hulseberg Randy J and Hulseberg Julie A
Bought by
Hanson Robert J and Hanson Beverly A
Home Financials for this Owner
Home Financials are based on the most recent Mortgage that was taken out on this home.
Original Mortgage
$106,950
Interest Rate
6.78%
Mortgage Type
Unknown
Create a Home Valuation Report for This Property
The Home Valuation Report is an in-depth analysis detailing your home's value as well as a comparison with similar homes in the area
Home Values in the Area
Average Home Value in this Area
Purchase History
| Date | Buyer | Sale Price | Title Company |
|---|---|---|---|
| Reed Scot W | -- | None Available | |
| Reed Scot W | $123,500 | None Available | |
| Hanson Robert J | $114,500 | None Available |
Source: Public Records
Mortgage History
| Date | Status | Borrower | Loan Amount |
|---|---|---|---|
| Open | Reed Scot W | $94,000 | |
| Closed | Reed Scot W | $99,200 | |
| Previous Owner | Hanson Robert J | $106,950 |
Source: Public Records
Tax History Compared to Growth
Tax History
| Year | Tax Paid | Tax Assessment Tax Assessment Total Assessment is a certain percentage of the fair market value that is determined by local assessors to be the total taxable value of land and additions on the property. | Land | Improvement |
|---|---|---|---|---|
| 2025 | $2,854 | $198,100 | $37,800 | $160,300 |
| 2024 | $3,050 | $182,300 | $33,100 | $149,200 |
| 2023 | $3,050 | $171,700 | $33,100 | $138,600 |
| 2022 | $2,660 | $153,500 | $28,400 | $125,100 |
| 2021 | $2,666 | $137,400 | $28,400 | $109,000 |
| 2020 | $2,666 | $129,400 | $25,200 | $104,200 |
| 2019 | $2,490 | $124,000 | $25,200 | $98,800 |
| 2018 | $2,416 | $124,000 | $25,200 | $98,800 |
| 2017 | $2,416 | $118,600 | $25,200 | $93,400 |
| 2016 | $2,483 | $116,800 | $25,200 | $91,600 |
| 2015 | $2,563 | $120,422 | $25,200 | $95,222 |
| 2014 | $2,586 | $120,422 | $25,200 | $95,222 |
| 2013 | $2,322 | $120,422 | $25,200 | $95,222 |
Source: Public Records
Map
Nearby Homes
- 6008 Eastview Ave SW
- 6118 Greenbriar Ln SW Unit D
- 6305 Greenbriar Ln SW Unit B
- 5918 Sharon Ln NW
- 164 Cherry Hill Rd NW
- 6812 Underwood Ave SW
- 323 Norwick Rd SW
- 1590 Stoney Pt Rd & 6600 16th Ave SW
- 200 Cherry Park Dr NW
- 6608 Limestone Ct NW
- 225 Rockvalley Ln NW
- 509 Grey Slate Dr SW
- 6907 Rock Wood Dr SW
- 150 Meadowlark Ln NW
- 6916 Rock Wood Dr SW
- 106 Leroy St NW
- 614 Grey Slate Dr SW
- 620 Grey Slate Dr SW
- 5127 Holly Ave NW
- 916 Blue Stone St NW
- 124 Broadmore Rd SW
- 200 Broadmore Rd SW
- 116 Broadmore Rd SW
- 208 Broadmore Rd SW
- 108 Broadmore Rd SW
- 216 Broadmore Rd SW
- 205 Broadmore Rd SW
- 119 Broadmore Rd SW
- 111 Broadmore Rd SW
- 213 Broadmore Rd SW
- 100 Broadmore Rd SW
- 6106 Crestridge Ave SW
- 6052 Westview Ave SW
- 6047 Westview Ave SW
- 221 Broadmore Rd SW
- 6042 Westview Ave SW
- 6049 1st Ave SW
- 6041 Westview Ave SW
- 6050 Crestridge Ave SW
- 6041 1st Ave SW