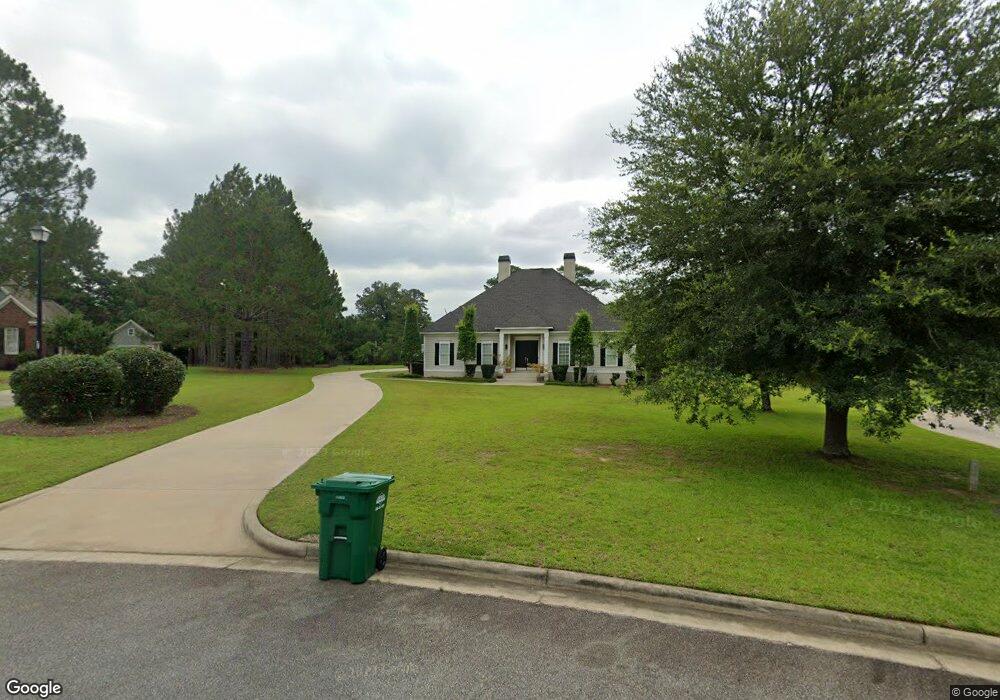
132 Browning Ct Leesburg, GA 31763
Estimated Value: $482,000 - $527,686
3
Beds
4
Baths
2,988
Sq Ft
$170/Sq Ft
Est. Value
About This Home
This home is located at 132 Browning Ct, Leesburg, GA 31763 and is currently estimated at $509,172, approximately $170 per square foot. 132 Browning Ct is a home located in Lee County with nearby schools including Lee County Primary School, Lee County Elementary School, and Lee County Middle School - West Campus.
Ownership History
Date
Name
Owned For
Owner Type
Purchase Details
Closed on
Mar 15, 2023
Sold by
Taylor Robert
Bought by
Scholl John
Current Estimated Value
Home Financials for this Owner
Home Financials are based on the most recent Mortgage that was taken out on this home.
Original Mortgage
$422,000
Outstanding Balance
$409,198
Interest Rate
6.32%
Mortgage Type
VA
Estimated Equity
$99,974
Purchase Details
Closed on
Sep 5, 2014
Sold by
Folmar Jason Clint and Brandi Rene
Bought by
Taylor Robert
Home Financials for this Owner
Home Financials are based on the most recent Mortgage that was taken out on this home.
Original Mortgage
$272,175
Interest Rate
4.2%
Mortgage Type
New Conventional
Purchase Details
Closed on
Oct 16, 2007
Sold by
Oakland Plantation Partner
Bought by
Folmar Brandi Rene and Folmar Jason Clint
Create a Home Valuation Report for This Property
The Home Valuation Report is an in-depth analysis detailing your home's value as well as a comparison with similar homes in the area
Home Values in the Area
Average Home Value in this Area
Purchase History
| Date | Buyer | Sale Price | Title Company |
|---|---|---|---|
| Scholl John | $422,000 | -- | |
| Taylor Robert | $286,500 | -- | |
| Folmar Brandi Rene | $50,500 | -- |
Source: Public Records
Mortgage History
| Date | Status | Borrower | Loan Amount |
|---|---|---|---|
| Open | Scholl John | $422,000 | |
| Previous Owner | Taylor Robert | $272,175 | |
| Closed | Folmar Brandi Rene | $0 |
Source: Public Records
Tax History Compared to Growth
Tax History
| Year | Tax Paid | Tax Assessment Tax Assessment Total Assessment is a certain percentage of the fair market value that is determined by local assessors to be the total taxable value of land and additions on the property. | Land | Improvement |
|---|---|---|---|---|
| 2024 | $4,253 | $140,800 | $18,000 | $122,800 |
| 2023 | $3,967 | $140,800 | $18,000 | $122,800 |
| 2022 | $3,967 | $140,800 | $18,000 | $122,800 |
| 2021 | $3,975 | $140,800 | $18,000 | $122,800 |
| 2020 | $4,573 | $138,160 | $20,000 | $118,160 |
| 2019 | $4,655 | $138,160 | $20,000 | $118,160 |
| 2018 | $4,656 | $138,160 | $20,000 | $118,160 |
| 2017 | $4,410 | $138,160 | $20,000 | $118,160 |
| 2016 | $4,259 | $133,440 | $20,000 | $113,440 |
| 2015 | $3,678 | $133,440 | $20,000 | $113,440 |
| 2014 | $4,234 | $133,440 | $20,000 | $113,440 |
| 2013 | -- | $133,440 | $20,000 | $113,440 |
Source: Public Records
Map
Nearby Homes
- 110 Tupelo Dr
- 130 Tupelo Dr
- 232 Tupelo Dr
- 170 Pointer Dr
- lt 132 Partridge Cir
- 245 Partridge Cir
- 241 Partridge Cir
- 103 Pointer Dr
- 130 Winifred Rd
- 174 Hank Dr
- 154 Hank Dr
- 119 Glen Arven Dr
- 186 Glen Arven Dr
- 126 Oakside Cir
- Lot 413 Willow Lake Dr
- Lot 414 Willow Lake Dr
- 317 Willow Lake Dr
- 227 Longleaf Dr
- 195 Willow Lake Dr
- 137 Chicory Ct
- 134 Browning Ct
- 130 Browning Ct
- 136 Browning Ct
- 124 Browning Ct
- 129 Ashley Ct
- 117 Ashley Ct
- 139 Browning Ct
- 135 Browning Ct
- 111 Ashley Ct
- 131 Browning Ct
- 00 Ashley Ct
- LOT 34 Ashley Ct
- 112 Browning Ct
- 125 Browning Ct
- 107 Ashley Ct
- 130 Ashley Ct
- 126 Ashley Ct
- 119 Browning Ct
- 134 Ashley Ct
- 106 Browning Ct