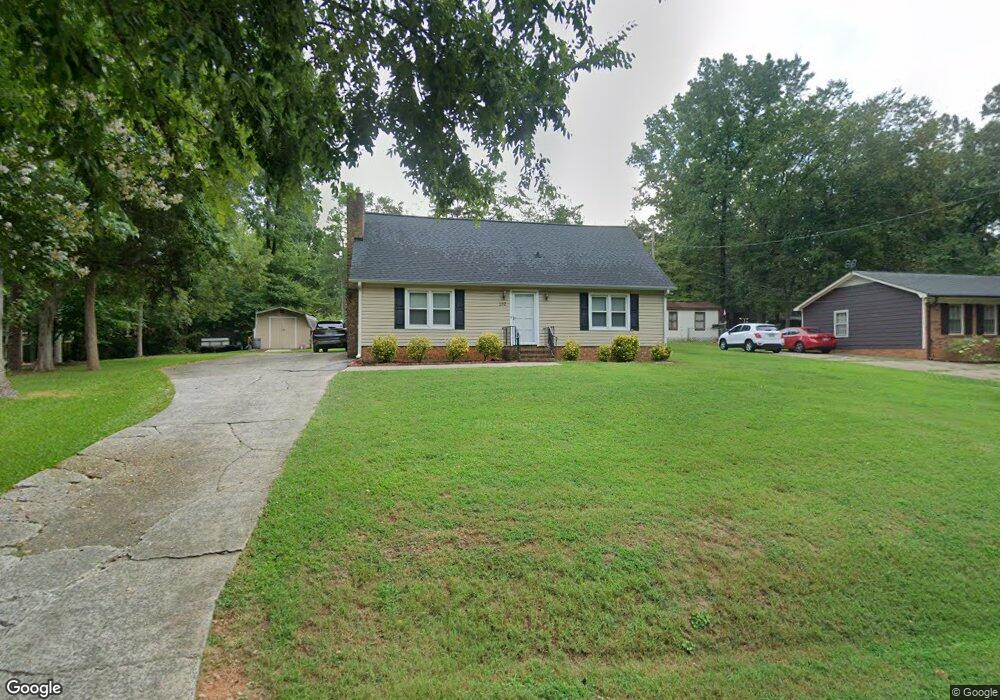
132 Burris St Wingate, NC 28174
Estimated Value: $316,478 - $343,000
4
Beds
2
Baths
2,060
Sq Ft
$159/Sq Ft
Est. Value
About This Home
This home is located at 132 Burris St, Wingate, NC 28174 and is currently estimated at $326,620, approximately $158 per square foot. 132 Burris St is a home located in Union County with nearby schools including Wingate Elementary School, East Union Middle School, and Forest Hills High School.
Ownership History
Date
Name
Owned For
Owner Type
Purchase Details
Closed on
Sep 25, 2002
Sold by
Jones Wendy Litaker and Mize David Julian
Bought by
Jenkins Chris and Jenkins Tammy
Current Estimated Value
Home Financials for this Owner
Home Financials are based on the most recent Mortgage that was taken out on this home.
Original Mortgage
$119,130
Outstanding Balance
$50,054
Interest Rate
6.19%
Mortgage Type
FHA
Estimated Equity
$276,566
Purchase Details
Closed on
Apr 6, 2000
Sold by
Michael Paul F and Michael Charlotte
Bought by
Jones Wendy Litaker
Home Financials for this Owner
Home Financials are based on the most recent Mortgage that was taken out on this home.
Original Mortgage
$74,500
Interest Rate
8.34%
Create a Home Valuation Report for This Property
The Home Valuation Report is an in-depth analysis detailing your home's value as well as a comparison with similar homes in the area
Home Values in the Area
Average Home Value in this Area
Purchase History
| Date | Buyer | Sale Price | Title Company |
|---|---|---|---|
| Jenkins Chris | $121,000 | -- | |
| Jones Wendy Litaker | $115,000 | -- |
Source: Public Records
Mortgage History
| Date | Status | Borrower | Loan Amount |
|---|---|---|---|
| Open | Jenkins Chris | $119,130 | |
| Previous Owner | Jones Wendy Litaker | $74,500 |
Source: Public Records
Tax History Compared to Growth
Tax History
| Year | Tax Paid | Tax Assessment Tax Assessment Total Assessment is a certain percentage of the fair market value that is determined by local assessors to be the total taxable value of land and additions on the property. | Land | Improvement |
|---|---|---|---|---|
| 2024 | $1,746 | $172,300 | $34,100 | $138,200 |
| 2023 | $1,714 | $172,300 | $34,100 | $138,200 |
| 2022 | $1,714 | $172,300 | $34,100 | $138,200 |
| 2021 | $1,713 | $172,300 | $34,100 | $138,200 |
| 2020 | $1,276 | $102,700 | $24,400 | $78,300 |
| 2019 | $1,192 | $102,700 | $24,400 | $78,300 |
| 2018 | $1,192 | $102,740 | $24,440 | $78,300 |
| 2017 | $1,244 | $102,700 | $24,400 | $78,300 |
| 2016 | $1,219 | $102,740 | $24,440 | $78,300 |
| 2015 | $1,229 | $102,740 | $24,440 | $78,300 |
| 2014 | $1,381 | $130,860 | $17,990 | $112,870 |
Source: Public Records
Map
Nearby Homes
- 201 Smith St Unit 13
- 0 Jeffrey Cir Unit 1
- 518 N Camden Rd
- 1137 Overbrook Place
- 1308 Fremont Dr
- 1342 Fremont Dr
- 1014 Overbrook Place
- 1313 Fremont Dr
- 1115 Overbrook Place
- 1301 Fremont Dr
- 1008 Overbrook Place
- 1338 Fremont Dr
- 1219 Fremont Dr
- 1018 Overbrook Place
- 1305 Fremont Dr
- 1320 Fremont Dr
- 1312 Fremont Dr
- 1022 Overbrook Place
- 1350 Fremont Dr
- 1107 Overbrook Place