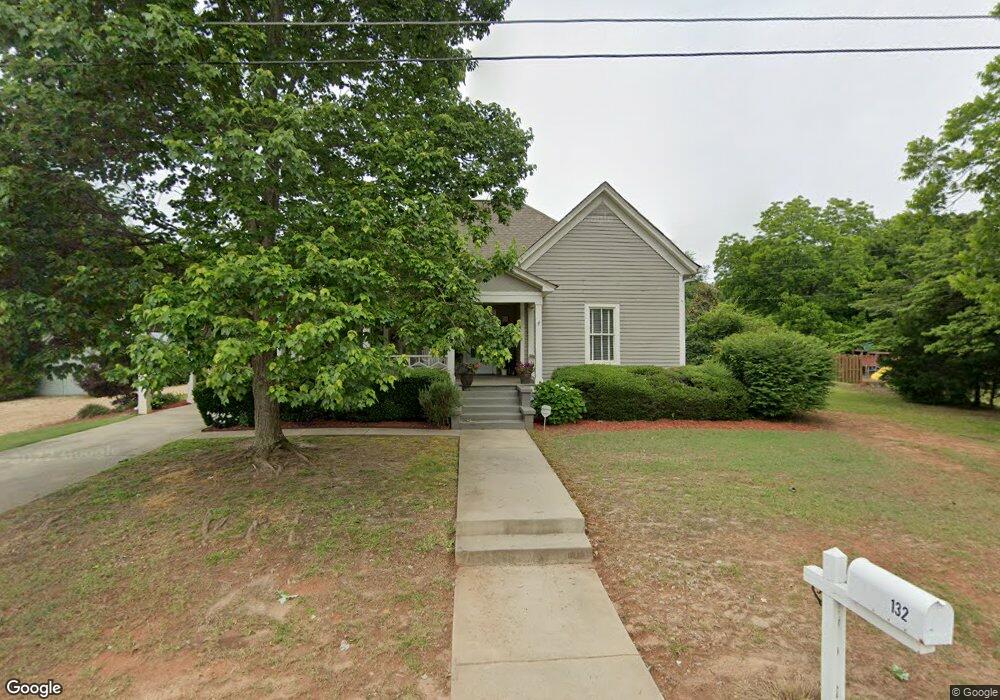
132 Clark St Senoia, GA 30276
Estimated Value: $751,000 - $930,945
3
Beds
4
Baths
4,012
Sq Ft
$211/Sq Ft
Est. Value
About This Home
This home is located at 132 Clark St, Senoia, GA 30276 and is currently estimated at $846,486, approximately $210 per square foot. 132 Clark St is a home located in Coweta County with nearby schools including Eastside Elementary School, East Coweta Middle School, and East Coweta High School.
Ownership History
Date
Name
Owned For
Owner Type
Purchase Details
Closed on
Jul 15, 2016
Sold by
David
Bought by
Patterson Robert W and Patterson Martha S
Current Estimated Value
Purchase Details
Closed on
Oct 31, 2011
Sold by
Stallings Nannette Huff
Bought by
Moye David and Moye Rhonda L
Home Financials for this Owner
Home Financials are based on the most recent Mortgage that was taken out on this home.
Original Mortgage
$44,000
Interest Rate
4.09%
Purchase Details
Closed on
Aug 19, 2011
Sold by
Stallings Hilton Inman
Bought by
Stallings Nannette Huff
Purchase Details
Closed on
Dec 29, 2001
Sold by
Stallings Harrell E
Bought by
Stallings Harrell E Estate
Purchase Details
Closed on
Jul 31, 1970
Bought by
Stallings Harrell E
Create a Home Valuation Report for This Property
The Home Valuation Report is an in-depth analysis detailing your home's value as well as a comparison with similar homes in the area
Home Values in the Area
Average Home Value in this Area
Purchase History
| Date | Buyer | Sale Price | Title Company |
|---|---|---|---|
| Patterson Robert W | $410,000 | -- | |
| Moye David | $55,000 | -- | |
| Stallings Nannette Huff | -- | -- | |
| Stallings Harrell E Estate | -- | -- | |
| Stallings Harrell E | $9,600 | -- |
Source: Public Records
Mortgage History
| Date | Status | Borrower | Loan Amount |
|---|---|---|---|
| Previous Owner | Moye David | $44,000 |
Source: Public Records
Tax History
| Year | Tax Paid | Tax Assessment Tax Assessment Total Assessment is a certain percentage of the fair market value that is determined by local assessors to be the total taxable value of land and additions on the property. | Land | Improvement |
|---|---|---|---|---|
| 2025 | $7,638 | $304,106 | $45,000 | $259,106 |
| 2024 | $5,353 | $228,521 | $45,000 | $183,521 |
| 2023 | $5,353 | $216,228 | $45,000 | $171,228 |
Source: Public Records
Map
Nearby Homes
- 99 Middle St Unit lot 8
- 36 Broad St
- 126 Morgan St
- 124 Morgan St
- 103 Morgan St
- 71 Lower Creek Trail
- 63 Lower Creek Trail
- 37 Coweta St
- 0 Quick Dr Unit 10711623
- 27 Coweta St
- 235 Farrell Creek Dr
- 374 A Luther Bailey Rd
- 65 Redhaven Dr
- 120 Redhaven Dr
- 130 Redhaven Dr
- 140 Redhaven Dr
- 150 Redhaven Dr
- 180 Redhaven Dr
- 215 Redhaven Dr
- 50 Greylock Creek Dr
Your Personal Tour Guide
Ask me questions while you tour the home.