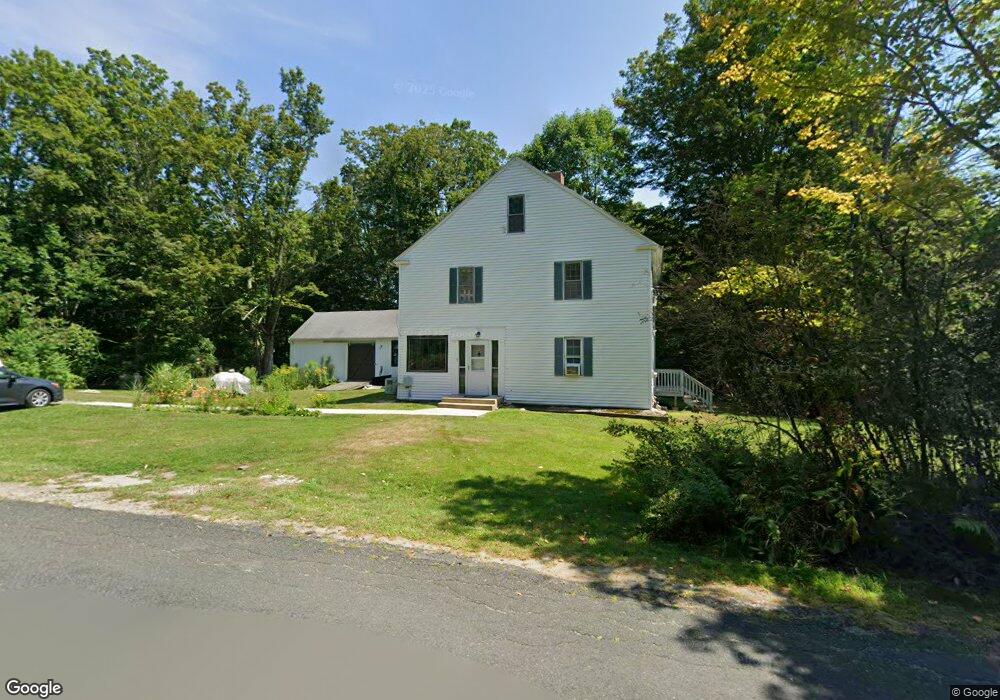
132 East Rd Orange, MA 01364
Estimated Value: $346,883 - $502,000
4
Beds
2
Baths
2,384
Sq Ft
$174/Sq Ft
Est. Value
About This Home
This home is located at 132 East Rd, Orange, MA 01364 and is currently estimated at $415,471, approximately $174 per square foot. 132 East Rd is a home located in Franklin County with nearby schools including Fisher Hill and Ralph C Mahar Regional School.
Ownership History
Date
Name
Owned For
Owner Type
Purchase Details
Closed on
Mar 5, 1998
Sold by
Lyman Frederick W and Lyman Mary Sf
Bought by
Almadan Inc
Current Estimated Value
Home Financials for this Owner
Home Financials are based on the most recent Mortgage that was taken out on this home.
Original Mortgage
$79,200
Interest Rate
6.93%
Mortgage Type
Purchase Money Mortgage
Create a Home Valuation Report for This Property
The Home Valuation Report is an in-depth analysis detailing your home's value as well as a comparison with similar homes in the area
Home Values in the Area
Average Home Value in this Area
Purchase History
| Date | Buyer | Sale Price | Title Company |
|---|---|---|---|
| Almadan Inc | $85,000 | -- |
Source: Public Records
Mortgage History
| Date | Status | Borrower | Loan Amount |
|---|---|---|---|
| Open | Almadan Inc | $247,000 | |
| Closed | Almadan Inc | $79,200 | |
| Previous Owner | Almadan Inc | $120,000 | |
| Previous Owner | Almadan Inc | $50,000 |
Source: Public Records
Tax History
| Year | Tax Paid | Tax Assessment Tax Assessment Total Assessment is a certain percentage of the fair market value that is determined by local assessors to be the total taxable value of land and additions on the property. | Land | Improvement |
|---|---|---|---|---|
| 2025 | $43 | $263,100 | $36,800 | $226,300 |
| 2024 | $4,899 | $280,900 | $36,800 | $244,100 |
| 2023 | $4,535 | $252,500 | $36,800 | $215,700 |
| 2022 | $4,692 | $245,400 | $36,800 | $208,600 |
| 2021 | $4,501 | $224,500 | $53,400 | $171,100 |
| 2020 | $4,412 | $217,000 | $53,000 | $164,000 |
| 2019 | $4,382 | $194,600 | $46,100 | $148,500 |
| 2018 | $4,267 | $194,500 | $43,100 | $151,400 |
| 2017 | $4,129 | $194,500 | $43,100 | $151,400 |
| 2016 | $3,958 | $182,400 | $43,100 | $139,300 |
| 2015 | $3,880 | $186,800 | $43,100 | $143,700 |
| 2014 | $3,413 | $172,900 | $43,100 | $129,800 |
Source: Public Records
Map
Nearby Homes
Your Personal Tour Guide
Ask me questions while you tour the home.