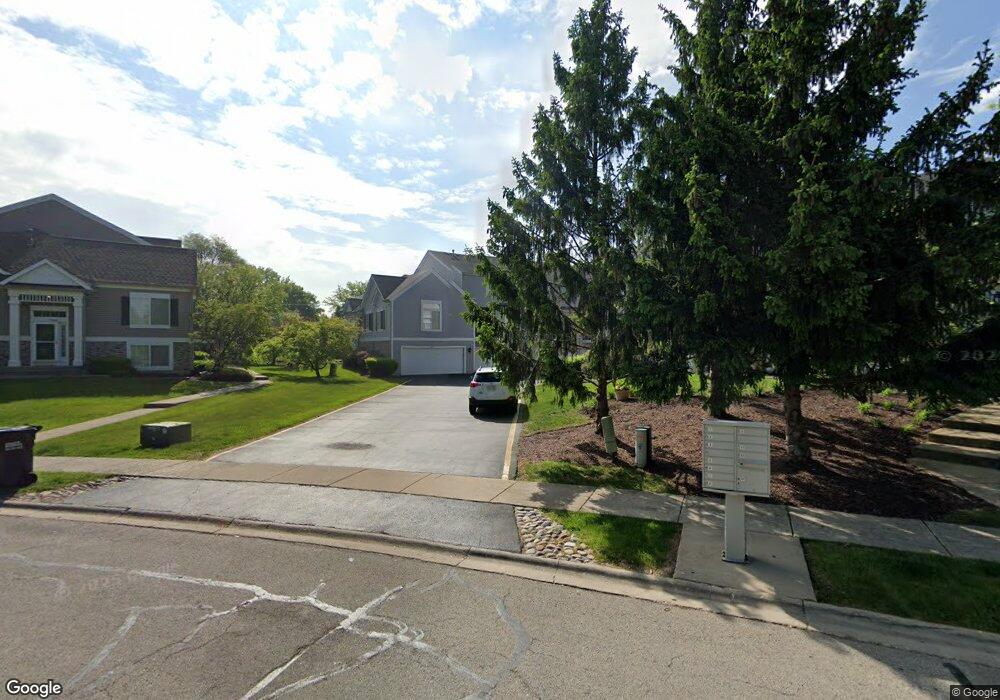
132 Enclave Cir Unit C Bolingbrook, IL 60440
East Bolingbrook NeighborhoodEstimated Value: $266,244 - $299,000
2
Beds
2
Baths
1,441
Sq Ft
$198/Sq Ft
Est. Value
About This Home
This home is located at 132 Enclave Cir Unit C, Bolingbrook, IL 60440 and is currently estimated at $285,811, approximately $198 per square foot. 132 Enclave Cir Unit C is a home located in Will County with nearby schools including John R Tibbott Elementary School, Brooks Middle School, and Hubert H Humphrey Middle School.
Ownership History
Date
Name
Owned For
Owner Type
Purchase Details
Closed on
May 12, 2017
Sold by
Nolan William Joseph
Bought by
Burowski Michael D
Current Estimated Value
Home Financials for this Owner
Home Financials are based on the most recent Mortgage that was taken out on this home.
Original Mortgage
$151,200
Outstanding Balance
$126,255
Interest Rate
4.25%
Mortgage Type
New Conventional
Estimated Equity
$159,556
Purchase Details
Closed on
Sep 27, 2016
Sold by
Bank Of America Na
Bought by
Nolan William Joseph
Purchase Details
Closed on
Jul 8, 2016
Sold by
Serrano Edward M and Serrano Johanna
Bought by
Bank Of America Na
Purchase Details
Closed on
Sep 23, 2004
Sold by
The Enclave Llc
Bought by
Serrano Edward M
Home Financials for this Owner
Home Financials are based on the most recent Mortgage that was taken out on this home.
Original Mortgage
$165,000
Interest Rate
6.75%
Mortgage Type
Purchase Money Mortgage
Create a Home Valuation Report for This Property
The Home Valuation Report is an in-depth analysis detailing your home's value as well as a comparison with similar homes in the area
Home Values in the Area
Average Home Value in this Area
Purchase History
| Date | Buyer | Sale Price | Title Company |
|---|---|---|---|
| Burowski Michael D | $168,000 | None Available | |
| Nolan William Joseph | $117,500 | Attorney | |
| Bank Of America Na | -- | Attorney | |
| Serrano Edward M | $194,500 | Ticor Title |
Source: Public Records
Mortgage History
| Date | Status | Borrower | Loan Amount |
|---|---|---|---|
| Open | Burowski Michael D | $151,200 | |
| Previous Owner | Serrano Edward M | $165,000 |
Source: Public Records
Tax History
| Year | Tax Paid | Tax Assessment Tax Assessment Total Assessment is a certain percentage of the fair market value that is determined by local assessors to be the total taxable value of land and additions on the property. | Land | Improvement |
|---|---|---|---|---|
| 2024 | $6,204 | $75,172 | $17,224 | $57,948 |
| 2023 | $6,204 | $67,638 | $15,498 | $52,140 |
| 2022 | $5,316 | $59,783 | $13,698 | $46,085 |
| 2021 | $5,024 | $55,898 | $12,808 | $43,090 |
| 2020 | $4,861 | $54,060 | $12,387 | $41,673 |
| 2019 | $4,589 | $50,477 | $11,566 | $38,911 |
| 2018 | $4,200 | $46,437 | $10,640 | $35,797 |
| 2017 | $3,984 | $44,016 | $10,085 | $33,931 |
| 2016 | $3,855 | $41,900 | $9,600 | $32,300 |
| 2015 | $3,662 | $39,000 | $8,900 | $30,100 |
| 2014 | $3,662 | $39,000 | $8,900 | $30,100 |
| 2013 | $3,662 | $48,700 | $11,100 | $37,600 |
Source: Public Records
Map
Nearby Homes
- 140 Enclave Cir Unit C
- 125 Monterey Dr
- 103 Enclave Cir Unit C
- 196 Hadleigh Rd
- 127 Monticello Cir
- 401 Salem Square
- 408 Colony Ct Unit 4
- 234 Malibu Dr
- 426 Greentree Ln Unit 6
- 112 Brook Ct
- 325 Rockhurst Rd
- 153 Camelot Way
- 220 N Ashbury Ave
- 316 Bedford Rd
- 207 Seabury Rd
- 226 Grant Dr
- 252 S Ashbury Ave
- 5 E Fernwood Dr
- 124 Seabury Rd
- 80 Fernwood Dr Unit O
- 132 Enclave Cir Unit E
- 132 Enclave Cir Unit D
- 132 Enclave Cir Unit A
- 132 Enclave Cir Unit 1
- 132 Enclave Cir Unit B
- 105 Malibu Dr
- 134 Enclave Cir Unit A
- 134 Enclave Cir Unit B
- 134 Enclave Cir Unit 5
- 134 Enclave Cir Unit D
- 134 Enclave Cir Unit C
- 134 Enclave Cir Unit E
- 196 E Briarcliff Rd
- 109 Malibu Dr
- 130 Enclave Cir Unit A
- 130 Enclave Cir Unit D
- 130 Enclave Cir Unit C
- 130 Enclave Cir Unit B
- 113 Malibu Dr
- 136 Enclave Cir Unit A
Your Personal Tour Guide
Ask me questions while you tour the home.