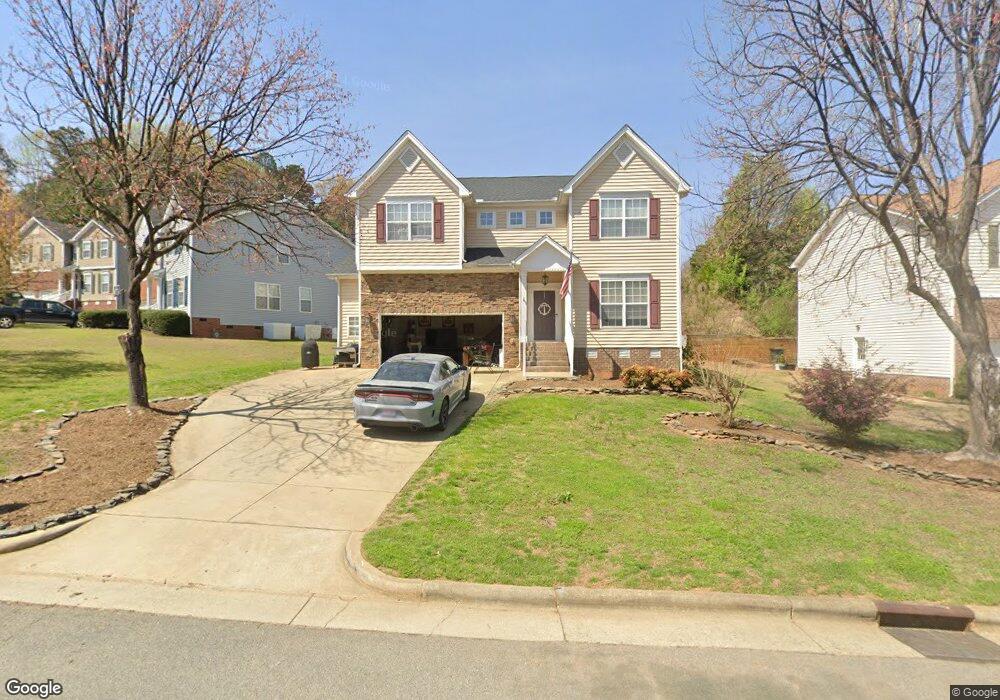
132 Faldo Cove Raleigh, NC 27603
Estimated Value: $512,000 - $553,000
5
Beds
3
Baths
3,015
Sq Ft
$175/Sq Ft
Est. Value
About This Home
This home is located at 132 Faldo Cove, Raleigh, NC 27603 and is currently estimated at $528,521, approximately $175 per square foot. 132 Faldo Cove is a home located in Wake County with nearby schools including Vance Elementary School, North Garner Middle, and Garner High.
Ownership History
Date
Name
Owned For
Owner Type
Purchase Details
Closed on
Mar 25, 2010
Sold by
Kurtz Jennifer J and Kurtz Leonard G
Bought by
Thornton Corry W and Thornton Amanda
Current Estimated Value
Home Financials for this Owner
Home Financials are based on the most recent Mortgage that was taken out on this home.
Original Mortgage
$269,637
Outstanding Balance
$178,263
Interest Rate
4.93%
Mortgage Type
FHA
Estimated Equity
$350,258
Purchase Details
Closed on
Mar 30, 2006
Sold by
M/I Homes Of Raleigh Llc
Bought by
Kurtz Leonard G and Kurtz Jennifer J
Home Financials for this Owner
Home Financials are based on the most recent Mortgage that was taken out on this home.
Original Mortgage
$180,450
Interest Rate
6.25%
Mortgage Type
Fannie Mae Freddie Mac
Create a Home Valuation Report for This Property
The Home Valuation Report is an in-depth analysis detailing your home's value as well as a comparison with similar homes in the area
Home Values in the Area
Average Home Value in this Area
Purchase History
| Date | Buyer | Sale Price | Title Company |
|---|---|---|---|
| Thornton Corry W | $275,000 | None Available | |
| Kurtz Leonard G | $226,000 | None Available |
Source: Public Records
Mortgage History
| Date | Status | Borrower | Loan Amount |
|---|---|---|---|
| Open | Thornton Corry W | $269,637 | |
| Closed | Thornton Corry W | $269,637 | |
| Previous Owner | Kurtz Leonard G | $180,450 |
Source: Public Records
Tax History Compared to Growth
Tax History
| Year | Tax Paid | Tax Assessment Tax Assessment Total Assessment is a certain percentage of the fair market value that is determined by local assessors to be the total taxable value of land and additions on the property. | Land | Improvement |
|---|---|---|---|---|
| 2025 | $4,894 | $469,949 | $95,000 | $374,949 |
| 2024 | $4,877 | $469,949 | $95,000 | $374,949 |
| 2023 | $4,117 | $319,117 | $46,000 | $273,117 |
| 2022 | $3,759 | $319,117 | $46,000 | $273,117 |
| 2021 | $3,569 | $319,117 | $46,000 | $273,117 |
| 2020 | $3,521 | $319,117 | $46,000 | $273,117 |
| 2019 | $3,459 | $268,543 | $50,000 | $218,543 |
| 2018 | $3,207 | $268,543 | $50,000 | $218,543 |
| 2017 | $3,102 | $268,543 | $50,000 | $218,543 |
| 2016 | $3,063 | $268,543 | $50,000 | $218,543 |
| 2015 | $3,155 | $276,954 | $50,000 | $226,954 |
| 2014 | $3,006 | $276,954 | $50,000 | $226,954 |
Source: Public Records
Map
Nearby Homes
- 308 Mickleson Ridge Dr
- 101 Lyle Rd
- 205 Okamato St
- 1124 Armsleigh Ct
- 8529 Hurst Dr
- 286 Fosterton Cottage Way
- 361 Broomside Ave
- 264 Fosterton Cottage Way
- 7805 Crestwood Dr
- 262 Fosterton Cottage Way
- 334 Cottage Hill Way
- 100 Chalcedony St
- 304 Broomside Ave
- 288 Fosterton Cottage Way
- 276 Fosterton Cottage Way
- 292 Fosterton Cottage Way
- 290 Fosterton Cottage Way
- Hampton Plan at Exchange at 401 - The Reserve Series
- Aspire Plan at Exchange at 401 - The Reserve Series
- Mitchell Plan at Exchange at 401 - The Reserve Series
- 124 Faldo Cove
- 140 Faldo Cove
- 331 Mickleson Ridge Dr
- 116 Faldo Cove
- 325 Mickleson Ridge Dr
- 125 Faldo Cove
- 148 Faldo Cove
- 133 Faldo Cove
- 332 Mickleson Ridge Dr
- 117 Faldo Cove
- 141 Faldo Cove
- 145 Faldo Cove
- 156 Faldo Cove
- 317 Mickleson Ridge Dr
- 149 Faldo Cove
- 324 Mickleson Ridge Dr
- 100 Faldo Cove
- 157 Faldo Cove
- 118 Braid Ct
- 649 Seastone St