Estimated Value: $299,000 - $338,000
3
Beds
2
Baths
1,780
Sq Ft
$178/Sq Ft
Est. Value
About This Home
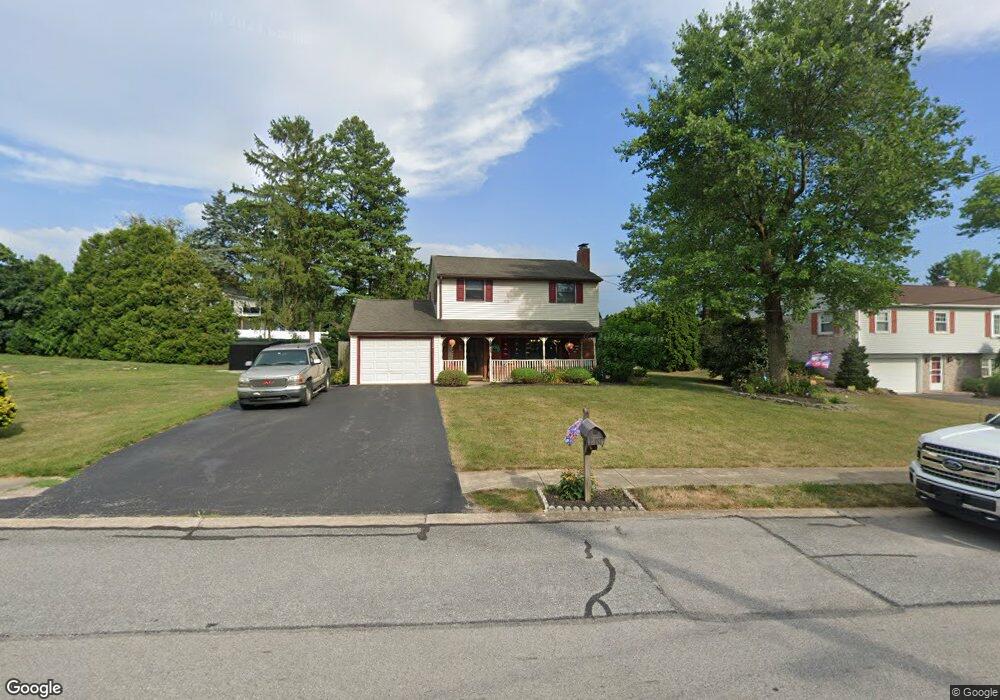
This home is located at 132 Farmview Dr, York, PA 17408 and is currently estimated at $316,873, approximately $178 per square foot. 132 Farmview Dr is a home located in York County with nearby schools including Spring Grove Area Middle School, Spring Grove Area High School, and St Rose Of Lima School.
Ownership History
Date
Name
Owned For
Owner Type
Purchase Details
Closed on
Aug 8, 2006
Sold by
Jarvis Wendy D
Bought by
Jarvis Troy and Jarvis Wendy D
Current Estimated Value
Home Financials for this Owner
Home Financials are based on the most recent Mortgage that was taken out on this home.
Original Mortgage
$188,510
Outstanding Balance
$110,890
Interest Rate
6.58%
Mortgage Type
FHA
Estimated Equity
$205,983
Purchase Details
Closed on
Jun 23, 2006
Sold by
King Rhonda A and King Donald J
Bought by
Jarvis Wendy
Home Financials for this Owner
Home Financials are based on the most recent Mortgage that was taken out on this home.
Original Mortgage
$188,510
Outstanding Balance
$110,890
Interest Rate
6.58%
Mortgage Type
FHA
Estimated Equity
$205,983
Purchase Details
Closed on
Jun 26, 2000
Sold by
Smith Steven M and Smith Rhonda A
Bought by
Smith Rhonda A
Home Financials for this Owner
Home Financials are based on the most recent Mortgage that was taken out on this home.
Original Mortgage
$50,000
Interest Rate
8.48%
Mortgage Type
Credit Line Revolving
Create a Home Valuation Report for This Property
The Home Valuation Report is an in-depth analysis detailing your home's value as well as a comparison with similar homes in the area
Home Values in the Area
Average Home Value in this Area
Purchase History
| Date | Buyer | Sale Price | Title Company |
|---|---|---|---|
| Jarvis Troy | $190,000 | None Available | |
| Jarvis Wendy | $190,000 | None Available | |
| Smith Rhonda A | -- | -- |
Source: Public Records
Mortgage History
| Date | Status | Borrower | Loan Amount |
|---|---|---|---|
| Open | Jarvis Wendy | $188,510 | |
| Previous Owner | Smith Rhonda A | $50,000 |
Source: Public Records
Tax History Compared to Growth
Tax History
| Year | Tax Paid | Tax Assessment Tax Assessment Total Assessment is a certain percentage of the fair market value that is determined by local assessors to be the total taxable value of land and additions on the property. | Land | Improvement |
|---|---|---|---|---|
| 2025 | $4,674 | $140,970 | $25,940 | $115,030 |
| 2024 | $4,623 | $140,970 | $25,940 | $115,030 |
| 2023 | $4,623 | $140,970 | $25,940 | $115,030 |
| 2022 | $4,623 | $140,970 | $25,940 | $115,030 |
| 2021 | $4,422 | $140,970 | $25,940 | $115,030 |
| 2020 | $4,422 | $140,970 | $25,940 | $115,030 |
| 2019 | $4,326 | $140,970 | $25,940 | $115,030 |
| 2018 | $4,268 | $140,970 | $25,940 | $115,030 |
| 2017 | $4,169 | $140,970 | $25,940 | $115,030 |
| 2016 | $0 | $140,970 | $25,940 | $115,030 |
| 2015 | -- | $140,970 | $25,940 | $115,030 |
| 2014 | -- | $140,970 | $25,940 | $115,030 |
Source: Public Records
Map
Nearby Homes
- 113 Farmview Dr
- 8 Spring Ridge Dr
- 652 Stoverstown Rd
- 932 Hanover Rd
- 1121 Pine Ct
- 87 Farm House Ln
- 238 Perry Ave
- 22 Landing Place Unit 22
- 19 Landing Place Unit 19
- 21 Landing Place Unit 21
- 20 Landing Place Unit 20
- 5 Landing Place
- 7 Landing Place Unit 7
- 4 Landing Place Unit 4
- 277 Valley View Cir Unit 94
- 1143 Willow Ct Unit 165
- 282 Valley View Cir Unit 141
- 272 Valley View Cir Unit 142
- 168 Dolomite Dr
- 115 Dolomite Dr Unit 41A
- 128 Farmview Dr
- 126 Pine Springs Blvd
- 118 Pine Springs Blvd
- 124 Farmview Dr
- 132 Pine Springs Blvd
- 133 Farmview Dr
- 118 Farmview Dr
- 129 Farmview Dr
- 110 Pine Springs Blvd
- Lot Pine Springs Blvd
- 119 Pine Springs Blvd
- 112 Farmview Dr
- 121 Farmview Dr
- 106 Pine Springs Blvd
- 115 Pine Springs Blvd
- 121 Pine Springs Blvd
- 109 Pine Springs Blvd
- 160 Lester Ave
- 156 Lester Ave
- 117 Farmview Dr