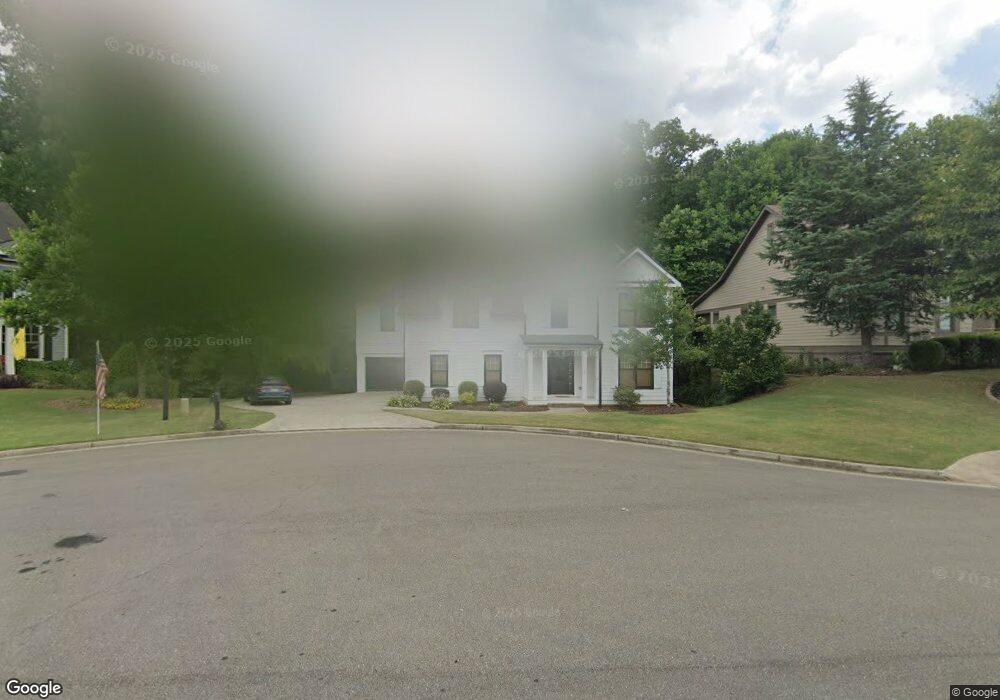
132 Generals Place Unit I-17 Canton, GA 30114
Estimated Value: $736,220 - $763,000
5
Beds
4
Baths
5,030
Sq Ft
$149/Sq Ft
Est. Value
About This Home
This home is located at 132 Generals Place Unit I-17, Canton, GA 30114 and is currently estimated at $749,610, approximately $149 per square foot. 132 Generals Place Unit I-17 is a home located in Cherokee County with nearby schools including J. Knox Elementary School, Teasley Middle School, and Cherokee High School.
Ownership History
Date
Name
Owned For
Owner Type
Purchase Details
Closed on
Oct 21, 2021
Sold by
Jackson Christopher
Bought by
Jackson Christopher and Cambric Nicole
Current Estimated Value
Purchase Details
Closed on
Nov 17, 2020
Sold by
Escobar Daniel D
Bought by
Jackson Christopher
Home Financials for this Owner
Home Financials are based on the most recent Mortgage that was taken out on this home.
Original Mortgage
$509,454
Interest Rate
2.8%
Mortgage Type
VA
Purchase Details
Closed on
Feb 28, 2014
Sold by
Gogolin Industries Llc
Bought by
Escobar Daniel D
Home Financials for this Owner
Home Financials are based on the most recent Mortgage that was taken out on this home.
Original Mortgage
$355,528
Interest Rate
4.35%
Mortgage Type
New Conventional
Purchase Details
Closed on
Sep 14, 2012
Sold by
Jeremy Rutenberg & Associa
Bought by
Gogolin Industries Llc
Create a Home Valuation Report for This Property
The Home Valuation Report is an in-depth analysis detailing your home's value as well as a comparison with similar homes in the area
Home Values in the Area
Average Home Value in this Area
Purchase History
| Date | Buyer | Sale Price | Title Company |
|---|---|---|---|
| Jackson Christopher | -- | -- | |
| Jackson Christopher | $498,000 | -- | |
| Escobar Daniel D | $374,240 | -- | |
| Gogolin Industries Llc | $106,000 | -- |
Source: Public Records
Mortgage History
| Date | Status | Borrower | Loan Amount |
|---|---|---|---|
| Previous Owner | Jackson Christopher | $509,454 | |
| Previous Owner | Escobar Daniel D | $355,528 |
Source: Public Records
Tax History Compared to Growth
Tax History
| Year | Tax Paid | Tax Assessment Tax Assessment Total Assessment is a certain percentage of the fair market value that is determined by local assessors to be the total taxable value of land and additions on the property. | Land | Improvement |
|---|---|---|---|---|
| 2025 | $1,851 | $266,280 | $54,000 | $212,280 |
| 2024 | $7,196 | $267,000 | $54,000 | $213,000 |
| 2023 | $6,453 | $256,000 | $50,000 | $206,000 |
| 2022 | $6,030 | $217,080 | $40,000 | $177,080 |
| 2021 | $5,750 | $188,560 | $29,600 | $158,960 |
| 2020 | $4,567 | $149,640 | $26,000 | $123,640 |
| 2019 | $4,528 | $148,240 | $26,000 | $122,240 |
| 2018 | $4,424 | $144,000 | $26,000 | $118,000 |
| 2017 | $3,462 | $349,100 | $26,000 | $113,640 |
| 2016 | $3,462 | $336,300 | $26,000 | $108,520 |
| 2015 | $3,392 | $326,600 | $26,000 | $104,640 |
| 2014 | $4,025 | $312,300 | $24,000 | $100,920 |
Source: Public Records
Map
Nearby Homes
- 405 Trumpet Cir
- 1209 Lakeside Overlook
- 845 Lakemont Dr
- 708 Woodlake Ct
- 208 Westbury Ct
- 320 River Green Ave
- 710 Bedford Trace Unit 3
- 619 River Bend Way
- 609 Arches Park Ln
- 148 Copper Hills Dr
- 133 Copper Hills Dr
- 616 Parkview Dr
- 7840 Knox Bridge Hwy
- 150 Jaime Dr
- 305 Blake Dr Unit 1
- 537 Oriole Farm Trail Unit 4L
- 117 Market Ln
- 106 Woodbury Ln
- 6261 Knox Bridge Hwy
- 993 Woodbury Rd
- 132 Generals Place
- 130 Generals Place
- 134 Generals Place
- 128 Generals Place
- 127 Generals Place
- 125 Generals Place
- 600 Redcoat Cir
- 126 Generals Place
- 121 Generals Place
- 602 Redcoat Cir
- 124 Generals Place
- 500 Union Cove
- 604 Redcoat Cir
- 122 Generals Place
- 502 Union Cove
- 117 Generals Place
- 115 Generals Place
- 503 Union Cove
- 118 Generals Place
- 505 Union Cove