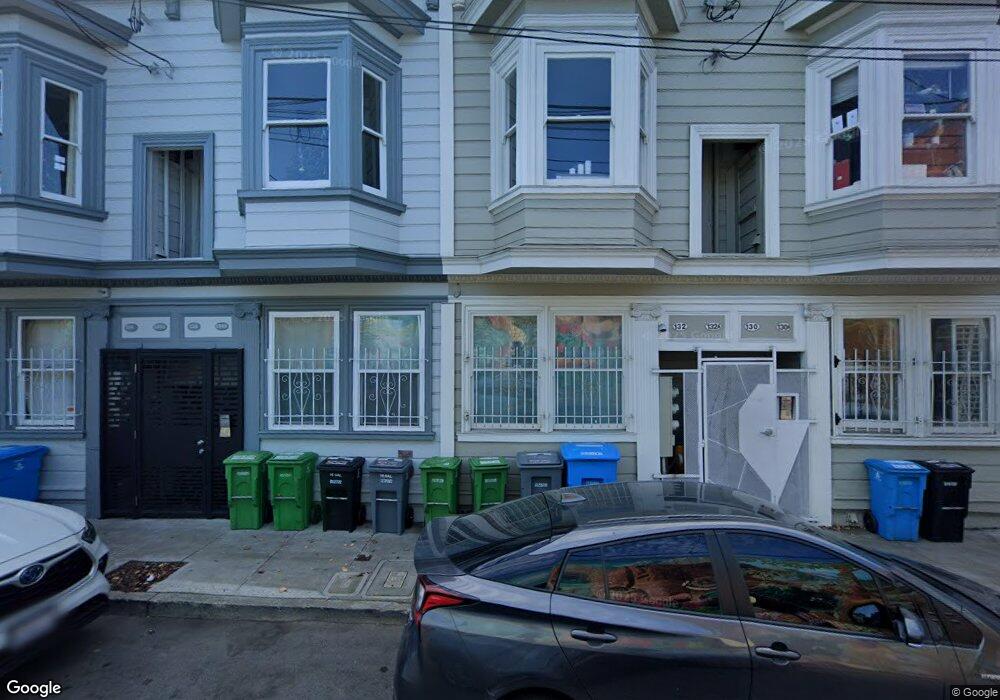
132 Langton St San Francisco, CA 94103
South of Market NeighborhoodEstimated Value: $632,000 - $837,000
2
Beds
2
Baths
1,000
Sq Ft
$739/Sq Ft
Est. Value
About This Home
This home is located at 132 Langton St, San Francisco, CA 94103 and is currently estimated at $739,130, approximately $739 per square foot. 132 Langton St is a home located in San Francisco County with nearby schools including Daniel Webster Elementary School, James Lick Middle School, and Five Keys Charter School.
Ownership History
Date
Name
Owned For
Owner Type
Purchase Details
Closed on
Nov 4, 2021
Sold by
Huang Bo and Zhang Ge
Bought by
Step Ahead Business Inc
Current Estimated Value
Purchase Details
Closed on
Sep 5, 2017
Sold by
Pandolfi Elisa M and Mulligan Brendan F
Bought by
Huang Bo and Zhang Ge
Home Financials for this Owner
Home Financials are based on the most recent Mortgage that was taken out on this home.
Original Mortgage
$424,000
Interest Rate
3.92%
Mortgage Type
New Conventional
Purchase Details
Closed on
Oct 16, 2012
Sold by
Floss Michael M
Bought by
Pandolfi Elisa M and Mullligan Brandan F
Home Financials for this Owner
Home Financials are based on the most recent Mortgage that was taken out on this home.
Original Mortgage
$472,000
Interest Rate
3.43%
Mortgage Type
New Conventional
Purchase Details
Closed on
Apr 16, 2007
Sold by
Mishra Sunil
Bought by
Floss Michael M
Home Financials for this Owner
Home Financials are based on the most recent Mortgage that was taken out on this home.
Original Mortgage
$116,000
Interest Rate
6.11%
Mortgage Type
Credit Line Revolving
Purchase Details
Closed on
Apr 1, 2004
Sold by
Mishra Sunil
Bought by
Mishra Sunil
Home Financials for this Owner
Home Financials are based on the most recent Mortgage that was taken out on this home.
Original Mortgage
$358,000
Interest Rate
4.37%
Mortgage Type
New Conventional
Purchase Details
Closed on
Oct 16, 2002
Sold by
Leblanc Pierre
Bought by
Mishra Sunil
Home Financials for this Owner
Home Financials are based on the most recent Mortgage that was taken out on this home.
Original Mortgage
$365,000
Interest Rate
5.37%
Purchase Details
Closed on
Oct 10, 2000
Sold by
Tarlow Ken and Tarlow Gail
Bought by
Leblanc Pierre
Home Financials for this Owner
Home Financials are based on the most recent Mortgage that was taken out on this home.
Original Mortgage
$365,400
Interest Rate
4.95%
Purchase Details
Closed on
Aug 29, 2000
Sold by
Roberta Demore
Bought by
Tarlow Ken and Tarlow Gail
Home Financials for this Owner
Home Financials are based on the most recent Mortgage that was taken out on this home.
Original Mortgage
$365,400
Interest Rate
4.95%
Purchase Details
Closed on
Jun 26, 1995
Sold by
Macdonald Donald W
Bought by
Demore Roberta
Home Financials for this Owner
Home Financials are based on the most recent Mortgage that was taken out on this home.
Original Mortgage
$161,950
Interest Rate
7.88%
Create a Home Valuation Report for This Property
The Home Valuation Report is an in-depth analysis detailing your home's value as well as a comparison with similar homes in the area
Home Values in the Area
Average Home Value in this Area
Purchase History
| Date | Buyer | Sale Price | Title Company |
|---|---|---|---|
| Step Ahead Business Inc | $775,000 | Fidelity National Title Co | |
| Huang Bo | $830,000 | Stewart Title Of Ca Inc | |
| Pandolfi Elisa M | $590,000 | Fidelity National Title Co | |
| Floss Michael M | $580,000 | Fidelity National Title Co | |
| Mishra Sunil | -- | Alliance Title | |
| Mishra Sunil | $415,000 | Fidelity National Title Co | |
| Leblanc Pierre | $406,000 | Financial Title Company | |
| Tarlow Ken | -- | California Land Title | |
| Demore Roberta | $170,500 | Chicago Title Company |
Source: Public Records
Mortgage History
| Date | Status | Borrower | Loan Amount |
|---|---|---|---|
| Previous Owner | Huang Bo | $424,000 | |
| Previous Owner | Pandolfi Elisa M | $472,000 | |
| Previous Owner | Floss Michael M | $116,000 | |
| Previous Owner | Floss Michael M | $464,000 | |
| Previous Owner | Mishra Sunil | $358,000 | |
| Previous Owner | Mishra Sunil | $365,000 | |
| Previous Owner | Leblanc Pierre | $365,400 | |
| Previous Owner | Demore Roberta | $161,950 |
Source: Public Records
Tax History Compared to Growth
Tax History
| Year | Tax Paid | Tax Assessment Tax Assessment Total Assessment is a certain percentage of the fair market value that is determined by local assessors to be the total taxable value of land and additions on the property. | Land | Improvement |
|---|---|---|---|---|
| 2025 | $10,567 | $822,436 | $411,218 | $411,218 |
| 2024 | $10,567 | $806,310 | $403,155 | $403,155 |
| 2023 | $10,374 | $790,500 | $395,250 | $395,250 |
| 2022 | $10,161 | $775,000 | $387,500 | $387,500 |
| 2021 | $11,299 | $872,478 | $436,239 | $436,239 |
| 2020 | $11,401 | $863,532 | $431,766 | $431,766 |
| 2019 | $11,016 | $846,600 | $423,300 | $423,300 |
| 2018 | $10,427 | $830,000 | $415,000 | $415,000 |
| 2017 | $7,806 | $626,010 | $313,005 | $313,005 |
| 2016 | $7,660 | $613,736 | $306,868 | $306,868 |
| 2015 | $7,562 | $604,518 | $302,259 | $302,259 |
| 2014 | $7,365 | $592,678 | $296,339 | $296,339 |
Source: Public Records
Map
Nearby Homes
- 370 7th St Unit 6
- 239 8th St Unit 14
- 39 Moss St
- 229 8th St Unit 3
- 720 Clementina St
- 155 Harriet St Unit 3
- 322 6th St Unit 3
- 603 Natoma St Unit 402
- 33 Harriet St
- 660 Natoma St Unit 1
- 988 Harrison St Unit SD8
- 988 Harrison St Unit CL6
- 988 Harrison St Unit JR2
- 988 Harrison St Unit S09
- 988 Harrison St Unit WA8
- 988 Harrison St Unit CN8
- 988 Harrison St Unit HN4
- 988 Harrison St Unit WC2
- 988 Harrison St Unit HN8
- Sage - X Plan at Renou
- 120 Langton St
- 110 Langton St
- 130 Langton St Unit A
- 130 Langton St
- 132A Langton St Unit 132A
- 130A Langton St Unit 130A
- 136A Langton St Unit 136A
- 136 Langton St Unit A
- 136 Langton St
- 134 Langton St Unit A
- 134 Langton St
- 140 Langton St
- 33 Hallam St
- 35 Hallam St
- 140A Langton St Unit 140A
- 138 Langton St
- 41 Hallam St
- 7 Hallam St Unit 2C
- 7 Hallam St Unit 2A
- 7 Hallam St Unit 1A