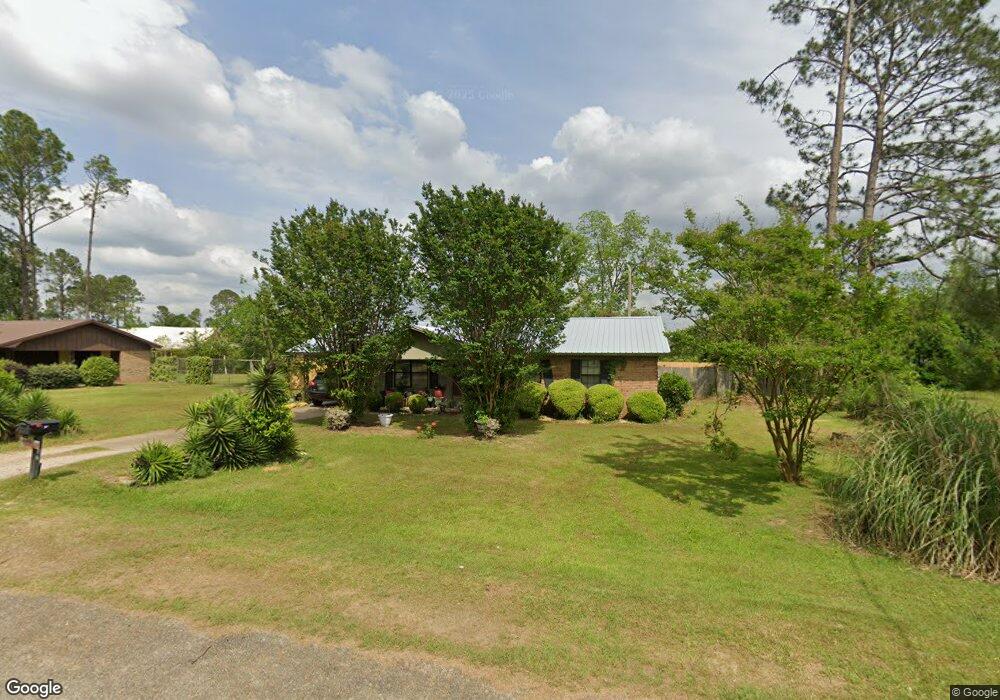
132 Lee Ann Rd Fitzgerald, GA 31750
Estimated Value: $103,000 - $119,864
3
Beds
2
Baths
1,155
Sq Ft
$98/Sq Ft
Est. Value
About This Home
This home is located at 132 Lee Ann Rd, Fitzgerald, GA 31750 and is currently estimated at $112,716, approximately $97 per square foot. 132 Lee Ann Rd is a home located in Ben Hill County with nearby schools including Ben Hill County Primary School, Ben Hill Elementary School, and Ben Hill County Middle School.
Ownership History
Date
Name
Owned For
Owner Type
Purchase Details
Closed on
Nov 30, 2017
Sold by
Scott King Properties Llc
Bought by
Jernigan Joseph P and Jernigan Mariena M
Current Estimated Value
Purchase Details
Closed on
Feb 6, 2015
Sold by
Paulk Investments Llc
Bought by
Scott King Properties Llc
Purchase Details
Closed on
Dec 6, 2005
Sold by
Paulk John
Bought by
Paulk Investments Llc
Purchase Details
Closed on
Aug 14, 1985
Bought by
Gibbs Michael A
Create a Home Valuation Report for This Property
The Home Valuation Report is an in-depth analysis detailing your home's value as well as a comparison with similar homes in the area
Purchase History
| Date | Buyer | Sale Price | Title Company |
|---|---|---|---|
| Jernigan Joseph P | $1,000 | -- | |
| Scott King Properties Llc | $207,500 | -- | |
| Paulk Investments Llc | -- | -- | |
| Paulk John | $38,000 | -- | |
| Gibbs Michael A | $38,400 | -- |
Source: Public Records
Tax History
| Year | Tax Paid | Tax Assessment Tax Assessment Total Assessment is a certain percentage of the fair market value that is determined by local assessors to be the total taxable value of land and additions on the property. | Land | Improvement |
|---|---|---|---|---|
| 2024 | $1,015 | $33,098 | $3,200 | $29,898 |
| 2023 | $975 | $31,781 | $2,800 | $28,981 |
| 2022 | $911 | $27,550 | $2,800 | $24,750 |
| 2021 | $876 | $25,504 | $2,800 | $22,704 |
| 2020 | $877 | $25,239 | $2,800 | $22,439 |
| 2019 | $874 | $25,239 | $2,800 | $22,439 |
| 2018 | $830 | $25,098 | $2,800 | $22,298 |
| 2017 | $866 | $24,886 | $2,800 | $22,086 |
| 2016 | $558 | $24,561 | $2,800 | $21,761 |
| 2015 | -- | $26,036 | $3,200 | $22,836 |
| 2014 | -- | $26,496 | $3,200 | $23,296 |
Source: Public Records
Map
Nearby Homes
- 196 Wilson Ave
- 127 Carol Cir
- 121 Thompson St
- 164 Peter Coffee Rd
- 237 Dewey McGlamry Rd
- 118 Flint St
- 251 Dewey McGlamry Rd
- 124 N Main Street Extension
- 107 Lobingier Ave
- 1095 N Merrimac Drive Extension
- 209 E Ohoopee St
- 409 W Sultana Dr
- 616 N Main St
- 229 Hudson Rd
- 503 N Main St
- 103 Grace Ave
- 342 Lower Rebecca Rd
- 103 Meadowood Ln
- 303 W Altamaha St
- 130 Meadowood Ln
- 130 Lee Ann Rd
- 134 Lee Ann Rd
- 118 Lee Ann Rd
- 300 Bowens Mill Hwy
- 136 Lee Ann Rd
- 133 Lee Ann Rd
- 0 Lee Ann Rd
- 126 Lee Ann Rd
- 138 Lee Ann Rd
- 129 Lee Ann Rd
- 143 Lee Ann Rd
- 125 Lee Ann Rd
- 122 Lee Ann Rd
- 142 Lee Ann Rd
- 290 Bowens Mill Hwy
- 119 Lisa Ln
- 123 Lee Ann Rd
- 147 Lee Ann Rd Unit 13
- 147 Lee Ann Rd
- 146 Lee Ann Rd