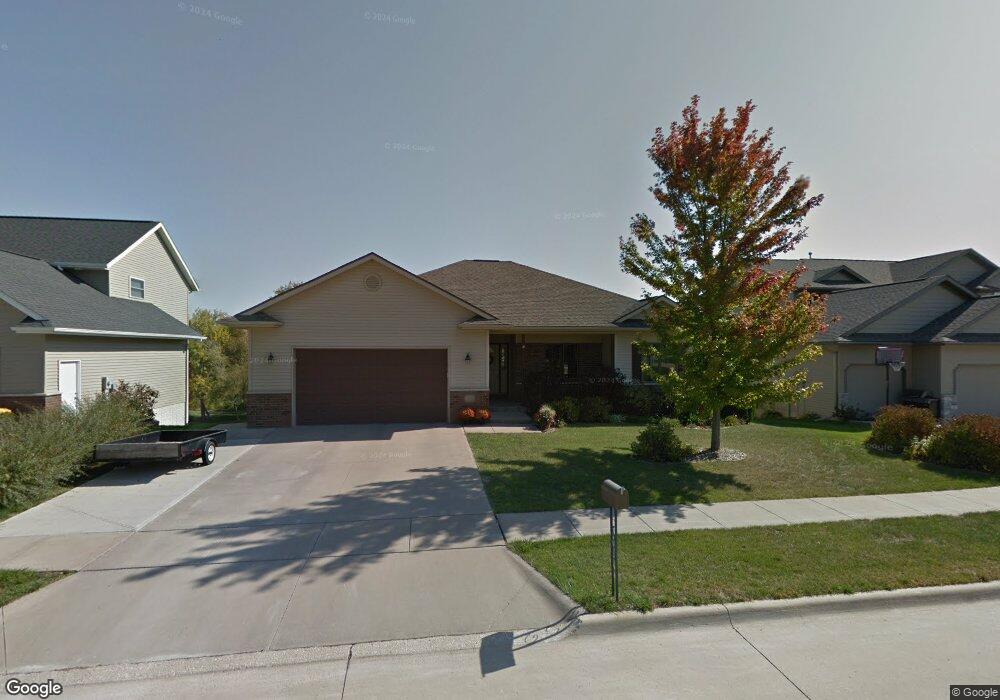
132 Lindemann Dr Iowa City, IA 52245
Estimated Value: $350,000 - $413,000
3
Beds
1
Bath
1,677
Sq Ft
$233/Sq Ft
Est. Value
About This Home
This home is located at 132 Lindemann Dr, Iowa City, IA 52245 and is currently estimated at $390,078, approximately $232 per square foot. 132 Lindemann Dr is a home located in Johnson County with nearby schools including Helen Lemme Elementary School, Southeast Junior High School, and City High School.
Ownership History
Date
Name
Owned For
Owner Type
Purchase Details
Closed on
Nov 8, 2022
Sold by
Roehl Larry J and Roehl Laurie E
Bought by
Larry J Roehi Revocable Trust and Laurie E Roehl Revocable Trust
Current Estimated Value
Purchase Details
Closed on
Dec 16, 2005
Sold by
Frantz Jerry L and Frantz Rayleen
Bought by
Roehl Larry J and Rroehl Laurie E
Home Financials for this Owner
Home Financials are based on the most recent Mortgage that was taken out on this home.
Original Mortgage
$180,000
Interest Rate
6.48%
Mortgage Type
New Conventional
Purchase Details
Closed on
Feb 21, 2005
Sold by
Walden Wood Associates Ii L L P
Bought by
Frantz Jerry L and Frantz Ravleen
Home Financials for this Owner
Home Financials are based on the most recent Mortgage that was taken out on this home.
Original Mortgage
$219,920
Interest Rate
5.8%
Mortgage Type
FHA
Create a Home Valuation Report for This Property
The Home Valuation Report is an in-depth analysis detailing your home's value as well as a comparison with similar homes in the area
Home Values in the Area
Average Home Value in this Area
Purchase History
| Date | Buyer | Sale Price | Title Company |
|---|---|---|---|
| Larry J Roehi Revocable Trust | -- | -- | |
| Roehl Larry J | $250,000 | None Available | |
| Frantz Jerry L | $53,000 | None Available |
Source: Public Records
Mortgage History
| Date | Status | Borrower | Loan Amount |
|---|---|---|---|
| Previous Owner | Roehl Larry J | $180,000 | |
| Previous Owner | Frantz Jerry L | $219,920 |
Source: Public Records
Tax History Compared to Growth
Tax History
| Year | Tax Paid | Tax Assessment Tax Assessment Total Assessment is a certain percentage of the fair market value that is determined by local assessors to be the total taxable value of land and additions on the property. | Land | Improvement |
|---|---|---|---|---|
| 2025 | $6,272 | $383,090 | $72,570 | $310,520 |
| 2024 | $6,314 | $353,130 | $62,680 | $290,450 |
| 2023 | $6,280 | $353,130 | $62,680 | $290,450 |
| 2022 | $5,998 | $298,590 | $62,680 | $235,910 |
| 2021 | $5,992 | $298,590 | $62,680 | $235,910 |
| 2020 | $5,992 | $285,700 | $59,380 | $226,320 |
| 2019 | $5,866 | $285,700 | $59,380 | $226,320 |
| 2018 | $5,866 | $275,520 | $59,380 | $216,140 |
| 2017 | $5,800 | $275,520 | $59,380 | $216,140 |
| 2016 | $5,202 | $250,020 | $49,480 | $200,540 |
| 2015 | $5,202 | $250,020 | $49,480 | $200,540 |
| 2014 | $5,010 | $240,350 | $42,880 | $197,470 |
Source: Public Records
Map
Nearby Homes
- 15 Mary Ct
- 253 Lindemann Dr
- 4121 Ruth St
- 4157 Anna St
- 139 S Scott Blvd
- 123 S Scott Blvd
- 149 S Scott Blvd
- 105 S Scott Blvd
- 103 S Scott Blvd
- 141 S Scott Blvd
- 161 S Scott Blvd
- 147 S Scott Blvd
- 143 S Scott Blvd
- 107 S Scott Blvd
- 281 Danielle St
- 0 Lower West Branch Rd SE
- 230 Kenneth Dr
- 109 Cayman St Unit 2D
- 282 Kenneth Dr
- 275 Camden Rd Unit 275
- 132 Lindemann Dr
- 142 Lindemann Dr
- 151 Lindemann Dr
- 122 Lindemann Dr
- 142 Lindemann Dr
- Lot 173 Lindemann Part 5
- Lot 163 Lindemann Part 6
- 112 Lindemann Dr
- 10 Mary Ct
- 152 Lindemann Dr
- 152 Lindemann Dr
- 11 Jeremy Ct
- 102 Lindemann Dr
- 30 Mary Ct
- 162 Lindemann Dr
- 162 Lindemann Dr
- 133 Charles Dr
- 143 Charles Dr
- 123 Charles Dr
- Lot 172 Lindemann Part 5