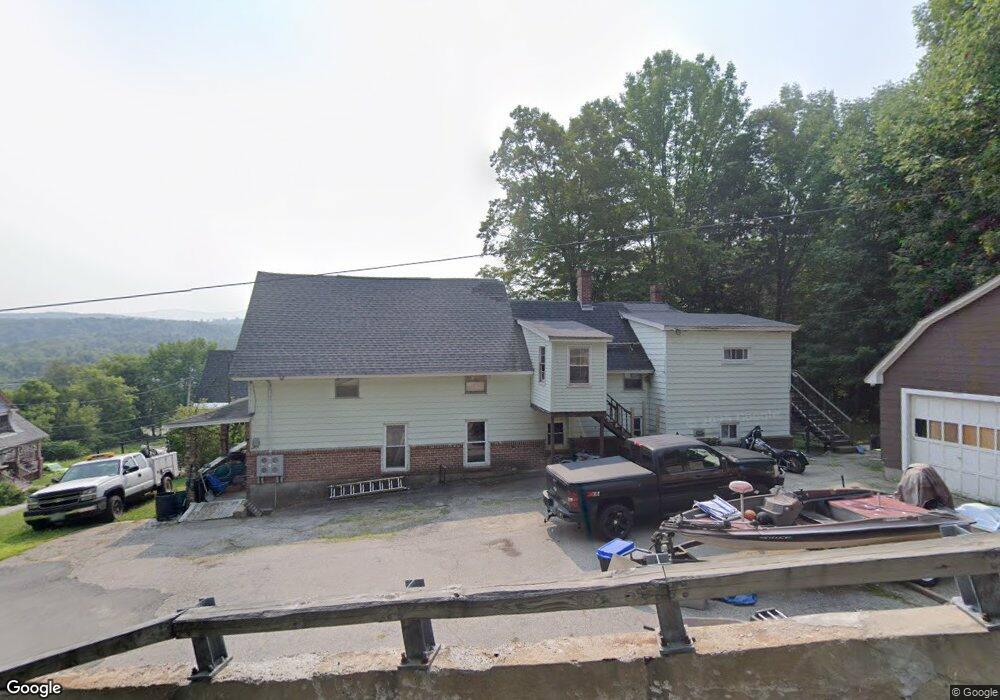
132 Maple St Berlin, NH 03570
Estimated Value: $143,000 - $264,436
7
Beds
3
Baths
2,921
Sq Ft
$66/Sq Ft
Est. Value
About This Home
This home is located at 132 Maple St, Berlin, NH 03570 and is currently estimated at $193,109, approximately $66 per square foot. 132 Maple St is a home located in Coos County with nearby schools including Berlin Elementary School, Berlin Middle School, and Berlin Senior High School.
Ownership History
Date
Name
Owned For
Owner Type
Purchase Details
Closed on
Jun 2, 2006
Sold by
Lundgren Frederick W and Lundgren Rachael
Bought by
Huot Scott
Current Estimated Value
Home Financials for this Owner
Home Financials are based on the most recent Mortgage that was taken out on this home.
Original Mortgage
$87,500
Outstanding Balance
$30,022
Interest Rate
8%
Mortgage Type
Adjustable Rate Mortgage/ARM
Estimated Equity
$163,087
Purchase Details
Closed on
Jun 1, 2004
Sold by
Black David K and Black Tracey L
Bought by
Lundgren Frederick W and Lundgren Rachel A
Home Financials for this Owner
Home Financials are based on the most recent Mortgage that was taken out on this home.
Original Mortgage
$74,250
Interest Rate
5.88%
Mortgage Type
Purchase Money Mortgage
Purchase Details
Closed on
Jul 26, 2002
Sold by
Vien Michael P
Bought by
Black David K and Black Tracey L
Home Financials for this Owner
Home Financials are based on the most recent Mortgage that was taken out on this home.
Original Mortgage
$39,900
Interest Rate
6.73%
Create a Home Valuation Report for This Property
The Home Valuation Report is an in-depth analysis detailing your home's value as well as a comparison with similar homes in the area
Purchase History
| Date | Buyer | Sale Price | Title Company |
|---|---|---|---|
| Huot Scott | $103,000 | -- | |
| Lundgren Frederick W | $82,500 | -- | |
| Black David K | $55,500 | -- |
Source: Public Records
Mortgage History
| Date | Status | Borrower | Loan Amount |
|---|---|---|---|
| Open | Black David K | $87,500 | |
| Closed | Black David K | $15,450 | |
| Previous Owner | Black David K | $74,250 | |
| Previous Owner | Black David K | $39,900 |
Source: Public Records
Tax History
| Year | Tax Paid | Tax Assessment Tax Assessment Total Assessment is a certain percentage of the fair market value that is determined by local assessors to be the total taxable value of land and additions on the property. | Land | Improvement |
|---|---|---|---|---|
| 2025 | $3,454 | $102,800 | $28,500 | $74,300 |
| 2024 | $3,175 | $102,800 | $28,500 | $74,300 |
| 2023 | $2,776 | $103,200 | $28,500 | $74,700 |
| 2022 | $4,332 | $158,900 | $28,500 | $130,400 |
| 2021 | $2,777 | $76,000 | $15,600 | $60,400 |
| 2020 | $2,731 | $76,000 | $15,600 | $60,400 |
| 2018 | $2,517 | $64,100 | $10,700 | $53,400 |
| 2017 | $2,336 | $59,600 | $7,200 | $52,400 |
| 2016 | $2,336 | $59,600 | $7,200 | $52,400 |
| 2014 | $3,298 | $98,900 | $13,400 | $85,500 |
| 2013 | $3,264 | $98,900 | $13,400 | $85,500 |
Source: Public Records
Map
Nearby Homes
Your Personal Tour Guide
Ask me questions while you tour the home.