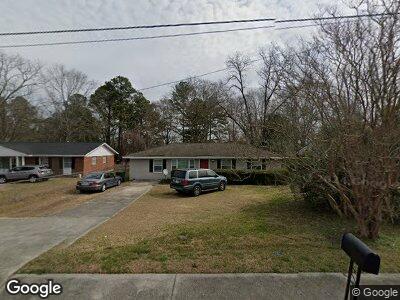
132 N Foss St Statesboro, GA 30458
Estimated Value: $90,000 - $185,000
3
Beds
1
Bath
1,275
Sq Ft
$112/Sq Ft
Est. Value
About This Home
This home is located at 132 N Foss St, Statesboro, GA 30458 and is currently estimated at $142,925, approximately $112 per square foot. 132 N Foss St is a home located in Bulloch County with nearby schools including Julia P. Bryant Elementary School, Statesboro High School, and William James Middle School.
Ownership History
Date
Name
Owned For
Owner Type
Purchase Details
Closed on
Mar 11, 2019
Sold by
Conley Benjamin M
Bought by
Lowe Mira
Current Estimated Value
Home Financials for this Owner
Home Financials are based on the most recent Mortgage that was taken out on this home.
Original Mortgage
$102,020
Outstanding Balance
$91,477
Interest Rate
4.4%
Mortgage Type
New Conventional
Estimated Equity
$62,169
Purchase Details
Closed on
Jul 28, 2017
Sold by
May Fannie
Bought by
Conley Benjamin M
Home Financials for this Owner
Home Financials are based on the most recent Mortgage that was taken out on this home.
Original Mortgage
$37,517
Interest Rate
3.88%
Mortgage Type
New Conventional
Purchase Details
Closed on
Jul 7, 2017
Bought by
Federal National Mtg Associati
Home Financials for this Owner
Home Financials are based on the most recent Mortgage that was taken out on this home.
Original Mortgage
$37,517
Interest Rate
3.88%
Mortgage Type
New Conventional
Create a Home Valuation Report for This Property
The Home Valuation Report is an in-depth analysis detailing your home's value as well as a comparison with similar homes in the area
Home Values in the Area
Average Home Value in this Area
Purchase History
| Date | Buyer | Sale Price | Title Company |
|---|---|---|---|
| Lowe Mira | $100,000 | -- | |
| Conley Benjamin M | $31,000 | -- | |
| Federal National Mtg Associati | $35,000 | -- |
Source: Public Records
Mortgage History
| Date | Status | Borrower | Loan Amount |
|---|---|---|---|
| Open | Lowe Mira | $102,020 | |
| Previous Owner | Conley Benjamin M | $37,517 | |
| Previous Owner | Hill L D | $135,000 |
Source: Public Records
Tax History Compared to Growth
Tax History
| Year | Tax Paid | Tax Assessment Tax Assessment Total Assessment is a certain percentage of the fair market value that is determined by local assessors to be the total taxable value of land and additions on the property. | Land | Improvement |
|---|---|---|---|---|
| 2024 | $897 | $34,736 | $4,200 | $30,536 |
| 2023 | $1,025 | $37,796 | $4,200 | $33,596 |
| 2022 | $602 | $32,686 | $4,200 | $28,486 |
| 2021 | $533 | $28,414 | $4,200 | $24,214 |
| 2020 | $526 | $27,340 | $4,200 | $23,140 |
| 2019 | $519 | $24,870 | $4,200 | $20,670 |
| 2018 | $465 | $21,370 | $4,200 | $17,170 |
| 2017 | $451 | $20,489 | $4,200 | $16,289 |
| 2016 | $454 | $20,110 | $4,200 | $15,910 |
| 2015 | $386 | $19,825 | $4,200 | $15,625 |
| 2014 | $354 | $18,952 | $4,200 | $14,752 |
Source: Public Records
Map
Nearby Homes
- 408 Tradewind Trail
- 106 Floyd St
- 270 Proctor St
- LOT 22 Oak Hill Dr
- 266 Proctor St
- 0 Pulaski Rd Unit 10458367
- 0 Pulaski Rd Unit 325524
- 0 Pulaski Rd Unit 10385082
- 113 Church St
- 0 Timber Rd
- 235 Johnson St
- 313 Miller St
- 9 Henry St
- 16 Church St
- 100 Buckhaven Way
- 318 N Main St
- 4 E Moore St
- 222 Sunview Dr
- 0 Highway 67 Unit 10485231
- 0 Highway 67 Unit 10426101