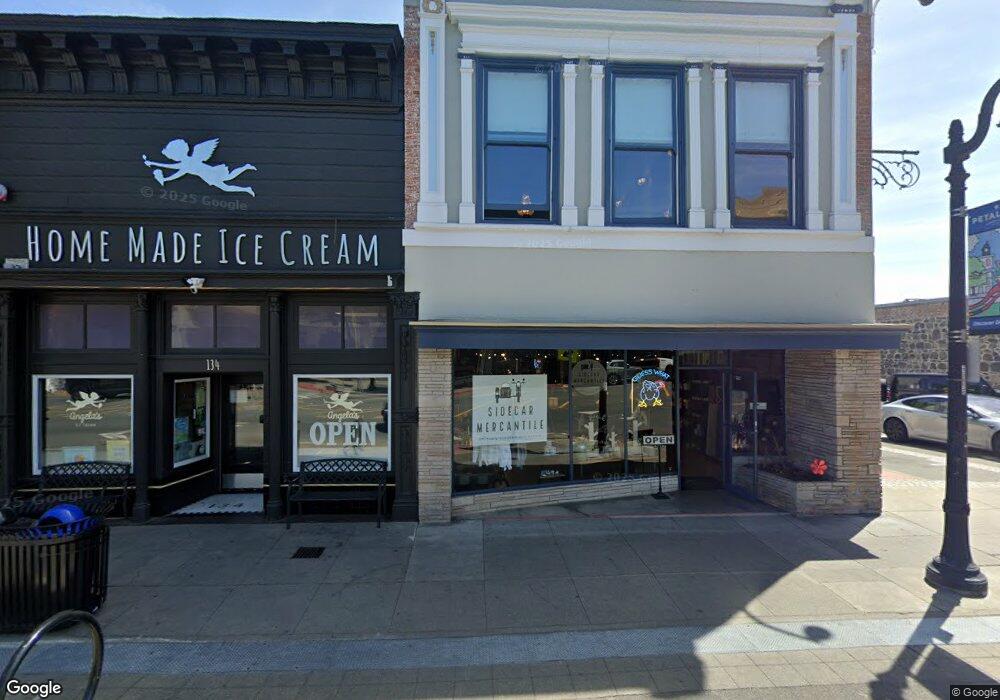
132 Petaluma Blvd N Petaluma, CA 94952
Downtown Petaluma NeighborhoodEstimated Value: $1,915,675
--
Bed
--
Bath
4,268
Sq Ft
$449/Sq Ft
Est. Value
About This Home
This home is located at 132 Petaluma Blvd N, Petaluma, CA 94952 and is currently estimated at $1,915,675, approximately $448 per square foot. 132 Petaluma Blvd N is a home located in Sonoma County with nearby schools including McKinley Elementary School, Petaluma Junior High School, and Petaluma High School.
Ownership History
Date
Name
Owned For
Owner Type
Purchase Details
Closed on
Jan 8, 2018
Sold by
Libarle Carol Ann and Montgomery George F
Bought by
L & K Arnone Llc
Current Estimated Value
Purchase Details
Closed on
Dec 6, 2017
Sold by
Danowski Michael
Bought by
Danowski Sharon
Purchase Details
Closed on
Jun 3, 2014
Sold by
Miller Sandra S
Bought by
Miller Sandra Sue and Sandra Sue Miller Revocable Tr
Purchase Details
Closed on
May 28, 2010
Sold by
Miller Cheryl T and Miller Craig
Bought by
Miller Cheryl T and Miller Craig
Purchase Details
Closed on
Feb 27, 2009
Sold by
Battaglia David and Danowski Sharon
Bought by
Battaglia David and Danowski Sharon
Purchase Details
Closed on
Feb 28, 2006
Sold by
Miller Craig A
Bought by
Miller Craig A and Miller Cheryl T
Purchase Details
Closed on
Feb 27, 2006
Sold by
Brown Cecelia A and Miller Craig A
Bought by
Brown Cecelia A and Miller Sandra S
Purchase Details
Closed on
Oct 25, 2002
Sold by
Montgomery Francis S and Montgomery 2002 Trust
Bought by
Montgomery George F and Pym George Skip Trust
Create a Home Valuation Report for This Property
The Home Valuation Report is an in-depth analysis detailing your home's value as well as a comparison with similar homes in the area
Home Values in the Area
Average Home Value in this Area
Purchase History
| Date | Buyer | Sale Price | Title Company |
|---|---|---|---|
| L & K Arnone Llc | $1,250,000 | First Amer Title Co | |
| Danowski Sharon | -- | First Amer Title Co | |
| Libarle Carol Ann | -- | First American Title Co | |
| Miller Sandra Sue | -- | None Available | |
| Miller Cheryl T | -- | None Available | |
| Battaglia David | -- | None Available | |
| Miller Craig A | -- | General Public | |
| Brown Cecelia A | -- | General Public | |
| Montgomery George F | -- | -- |
Source: Public Records
Tax History Compared to Growth
Tax History
| Year | Tax Paid | Tax Assessment Tax Assessment Total Assessment is a certain percentage of the fair market value that is determined by local assessors to be the total taxable value of land and additions on the property. | Land | Improvement |
|---|---|---|---|---|
| 2025 | $15,248 | $1,429,552 | $568,913 | $860,639 |
| 2024 | $15,248 | $1,401,522 | $557,758 | $843,764 |
| 2023 | $15,248 | $1,374,042 | $546,822 | $827,220 |
| 2022 | $14,778 | $1,340,250 | $536,100 | $804,150 |
| 2021 | $14,498 | $1,313,972 | $525,589 | $788,383 |
| 2020 | $14,624 | $1,300,500 | $520,200 | $780,300 |
| 2019 | $14,442 | $1,275,000 | $510,000 | $765,000 |
| 2018 | $993 | $74,116 | $30,840 | $43,276 |
| 2017 | $975 | $72,664 | $30,236 | $42,428 |
| 2016 | $945 | $71,241 | $29,644 | $41,597 |
| 2015 | $933 | $70,172 | $29,199 | $40,973 |
| 2014 | $930 | $68,799 | $28,628 | $40,171 |
Source: Public Records
Map
Nearby Homes
- 210 Keller St
- 131 Liberty St
- 136 Court St
- 331 Keller St Unit 11
- 505 Petaluma Blvd N
- 218 Edith St
- 531 E Washington St
- 65 Riverbend Ln
- Plan 3 Craftsman at Riverbend Petaluma - Craftsman
- 543 Madison St
- 0 Lakeville St
- 304 West St
- 853 D St
- 26 Wallace Ct
- 495 Cherry St
- 720 Petaluma Blvd S Unit 27
- 720 Petaluma Blvd S Unit 30
- 720 Petaluma Blvd S Unit 39
- 6 Liberty Ln
- 15 Townview Ln
- 134 Petaluma Blvd N
- 144 Petaluma Blvd N
- 125 Petaluma Blvd N
- 139 Petaluma Blvd N
- 110 Petaluma Blvd N
- 108 Petaluma Blvd N
- 130 Kentucky St
- 110 Kentucky St
- 24 Western Ave
- 24 Western Ave Unit 309
- 24 Western Ave Unit 304
- 24 Western Ave Unit 308
- 24 Western Ave Unit 311
- 24 Western Ave Unit 306
- 143 Kentucky St
- 127 Kentucky St
- 127 Kentucky St
- 10 E Washington St
- 121 Kentucky St
- 123 Kentucky St