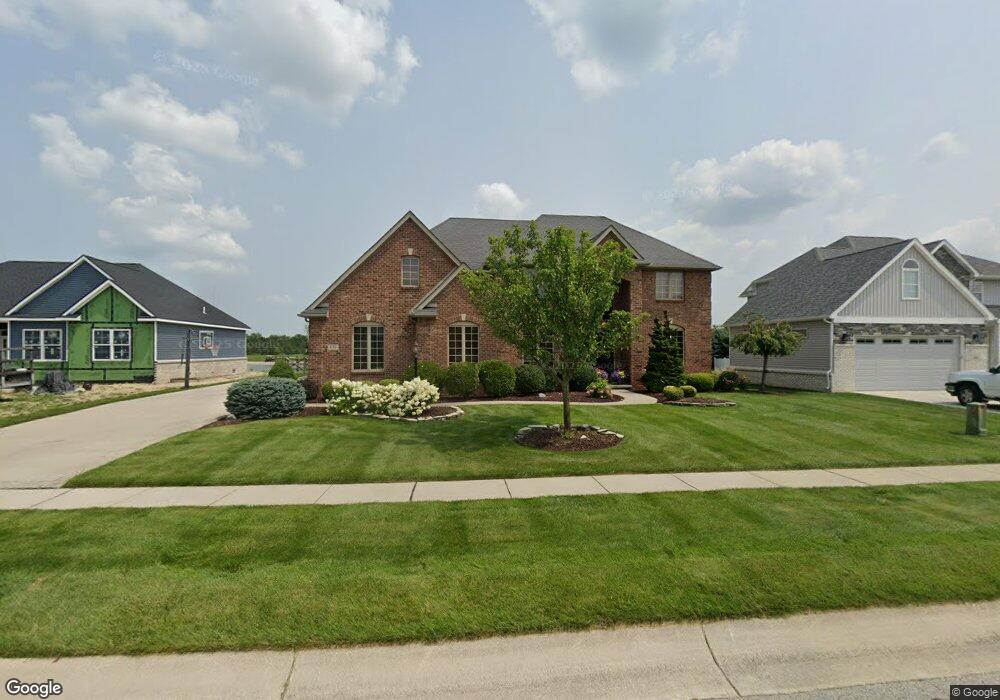
132 Pineview Dr Oregon, OH 43616
Estimated Value: $538,000 - $689,000
5
Beds
4
Baths
3,548
Sq Ft
$175/Sq Ft
Est. Value
About This Home
This home is located at 132 Pineview Dr, Oregon, OH 43616 and is currently estimated at $621,821, approximately $175 per square foot. 132 Pineview Dr is a home located in Lucas County.
Ownership History
Date
Name
Owned For
Owner Type
Purchase Details
Closed on
Oct 22, 2015
Sold by
Graham Noel E
Bought by
Tucker Scott D
Current Estimated Value
Home Financials for this Owner
Home Financials are based on the most recent Mortgage that was taken out on this home.
Original Mortgage
$328,500
Outstanding Balance
$256,592
Interest Rate
3.91%
Mortgage Type
New Conventional
Estimated Equity
$365,229
Purchase Details
Closed on
Aug 25, 2009
Sold by
Graham Noel E and Graham Noel E
Bought by
Graham Noel E
Purchase Details
Closed on
Jul 16, 2009
Sold by
Rumans Michelle M and Rumans Graham Michelle
Bought by
Graham Noel E
Purchase Details
Closed on
Nov 16, 2008
Sold by
Graham Noel E and Graham Michelle
Bought by
Graham Noel E and Rumans Graham Michelle
Purchase Details
Closed on
Oct 18, 2007
Sold by
Port Lawrence Title & Trust Co
Bought by
Graham Noel E and Graham Michelle
Home Financials for this Owner
Home Financials are based on the most recent Mortgage that was taken out on this home.
Original Mortgage
$253,000
Interest Rate
6.5%
Mortgage Type
Purchase Money Mortgage
Create a Home Valuation Report for This Property
The Home Valuation Report is an in-depth analysis detailing your home's value as well as a comparison with similar homes in the area
Home Values in the Area
Average Home Value in this Area
Purchase History
| Date | Buyer | Sale Price | Title Company |
|---|---|---|---|
| Tucker Scott D | $365,000 | None Available | |
| Graham Noel E | -- | Attorney | |
| Graham Noel E | -- | Attorney | |
| Graham Noel E | -- | None Available | |
| Graham Noel E | $46,000 | None Available |
Source: Public Records
Mortgage History
| Date | Status | Borrower | Loan Amount |
|---|---|---|---|
| Open | Tucker Scott D | $328,500 | |
| Previous Owner | Graham Noel E | $253,000 |
Source: Public Records
Tax History
| Year | Tax Paid | Tax Assessment Tax Assessment Total Assessment is a certain percentage of the fair market value that is determined by local assessors to be the total taxable value of land and additions on the property. | Land | Improvement |
|---|---|---|---|---|
| 2025 | -- | $203,875 | $32,865 | $171,010 |
| 2024 | $4,853 | $203,875 | $32,865 | $171,010 |
| 2023 | $9,440 | $169,050 | $24,570 | $144,480 |
| 2022 | $9,509 | $169,050 | $24,570 | $144,480 |
| 2021 | $9,585 | $169,050 | $24,570 | $144,480 |
| 2020 | $8,899 | $139,370 | $20,720 | $118,650 |
| 2019 | $8,647 | $139,370 | $20,720 | $118,650 |
| 2018 | $8,171 | $139,370 | $20,720 | $118,650 |
| 2017 | $7,883 | $118,965 | $15,085 | $103,880 |
| 2016 | $7,783 | $339,900 | $43,100 | $296,800 |
| 2015 | $7,732 | $339,900 | $43,100 | $296,800 |
| 2014 | $7,110 | $116,660 | $14,810 | $101,850 |
| 2013 | $7,110 | $116,660 | $14,810 | $101,850 |
Source: Public Records
Map
Nearby Homes
- 5914 Kacy Ln
- 5882 Kacy Ln
- 155 N Stadium Rd
- 454 Cody Dr
- 5415 Seaman Rd
- 1139 N Stadium Rd
- 234 Avilyn Ln
- 5054 Magnolia Dr
- 5065 Magnolia Dr
- 5051 Magnolia Dr
- 5045 Magnolia Dr
- 5048 Magnolia Dr
- 373 Jude Rd
- 7330 Jerusalem Rd
- 5037 Easton Dr
- 5040 Easton Dr
- 5033 Easton Dr
- 5036 Easton Dr
- 5029 Easton Dr
- 5032 Easton Dr
- 140 Pineview Dr
- 124 Pineview Dr
- 148 Pineview Dr
- 116 Pineview Dr Unit 16
- 116 Pineview Dr
- 108 Pineview Dr
- 156 Pineview Dr
- 133 Pineview Dr
- 125 Pineview Dr
- 109 Pineview Dr
- 141 Pineview Dr
- 117 Pineview Dr
- 149 Pineview Dr
- 157 Pineview Dr
- 100 Pineview Dr
- 101 Pineview Dr
- 57 Pineview Dr
- 49 Pineview Dr
- 41 Pineview Dr
- 33 Pineview Dr
Your Personal Tour Guide
Ask me questions while you tour the home.