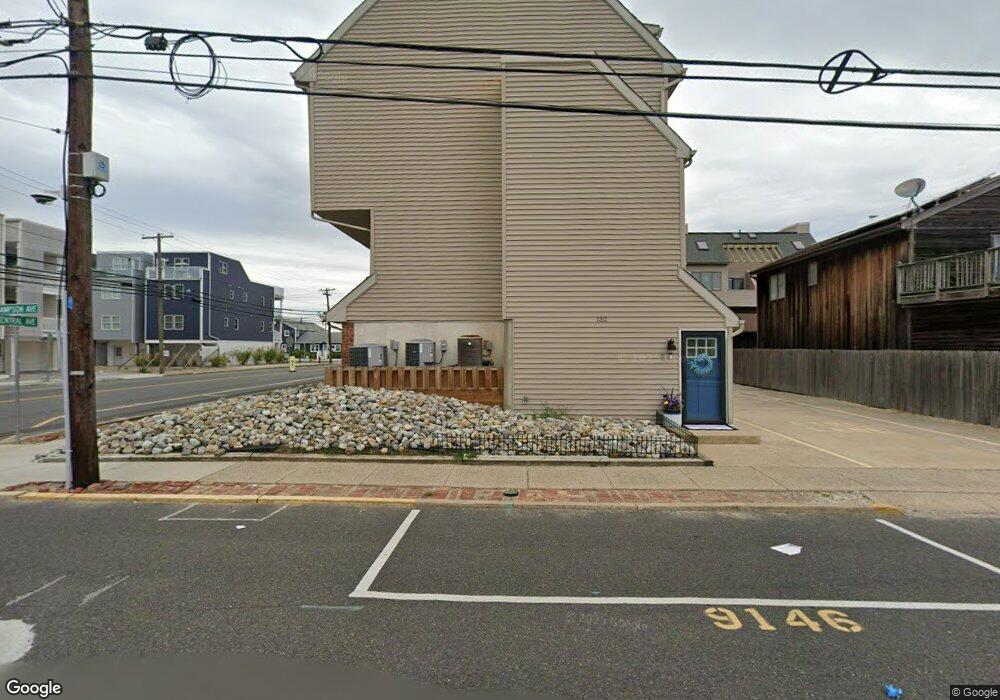
132 Sampson Ave Unit 34 Seaside Heights, NJ 08751
Estimated Value: $400,000 - $483,000
2
Beds
1
Bath
916
Sq Ft
$467/Sq Ft
Est. Value
About This Home
This home is located at 132 Sampson Ave Unit 34, Seaside Heights, NJ 08751 and is currently estimated at $427,616, approximately $466 per square foot. 132 Sampson Ave Unit 34 is a home located in Ocean County with nearby schools including Hugh J. Boyd Jr. Elementary School, Central Regional Middle School, and Central Regional High School.
Ownership History
Date
Name
Owned For
Owner Type
Purchase Details
Closed on
Nov 25, 2025
Sold by
Durkin Erin
Bought by
Rhatigan Catrina
Current Estimated Value
Home Financials for this Owner
Home Financials are based on the most recent Mortgage that was taken out on this home.
Original Mortgage
$272,000
Outstanding Balance
$272,000
Interest Rate
6.27%
Mortgage Type
New Conventional
Estimated Equity
$155,616
Purchase Details
Closed on
Dec 30, 2021
Sold by
Rodriguez and Milady
Bought by
Durkin Erin
Home Financials for this Owner
Home Financials are based on the most recent Mortgage that was taken out on this home.
Original Mortgage
$207,200
Interest Rate
3.22%
Mortgage Type
New Conventional
Purchase Details
Closed on
Sep 11, 2019
Sold by
Brown Eugene
Bought by
Rodriguez Danny and Rodriguez Milady
Home Financials for this Owner
Home Financials are based on the most recent Mortgage that was taken out on this home.
Original Mortgage
$138,000
Interest Rate
3.7%
Mortgage Type
New Conventional
Purchase Details
Closed on
Jul 30, 1997
Sold by
Cranberry Inlet Assoc
Bought by
Brown Eugene
Home Financials for this Owner
Home Financials are based on the most recent Mortgage that was taken out on this home.
Original Mortgage
$53,000
Interest Rate
7.55%
Create a Home Valuation Report for This Property
The Home Valuation Report is an in-depth analysis detailing your home's value as well as a comparison with similar homes in the area
Home Values in the Area
Average Home Value in this Area
Purchase History
| Date | Buyer | Sale Price | Title Company |
|---|---|---|---|
| Rhatigan Catrina | $410,000 | Pegasus Title | |
| Durkin Erin | $259,900 | Cengarle Julio | |
| Durkin Erin | $259,900 | None Listed On Document | |
| Rodriguez Danny | $172,500 | Main Street Title | |
| Brown Eugene | $58,500 | -- |
Source: Public Records
Mortgage History
| Date | Status | Borrower | Loan Amount |
|---|---|---|---|
| Open | Rhatigan Catrina | $272,000 | |
| Previous Owner | Durkin Erin | $207,200 | |
| Previous Owner | Rodriguez Danny | $138,000 | |
| Previous Owner | Brown Eugene | $53,000 |
Source: Public Records
Tax History Compared to Growth
Tax History
| Year | Tax Paid | Tax Assessment Tax Assessment Total Assessment is a certain percentage of the fair market value that is determined by local assessors to be the total taxable value of land and additions on the property. | Land | Improvement |
|---|---|---|---|---|
| 2025 | $5,572 | $342,800 | $175,000 | $167,800 |
| 2024 | $5,171 | $196,600 | $110,000 | $86,600 |
| 2023 | $4,917 | $196,600 | $110,000 | $86,600 |
| 2022 | $4,917 | $196,600 | $110,000 | $86,600 |
| 2021 | $4,758 | $196,600 | $110,000 | $86,600 |
| 2020 | $4,773 | $196,600 | $110,000 | $86,600 |
| 2019 | $4,630 | $196,600 | $110,000 | $86,600 |
| 2018 | $4,508 | $196,600 | $110,000 | $86,600 |
| 2017 | $4,424 | $196,600 | $110,000 | $86,600 |
| 2016 | $4,349 | $196,600 | $110,000 | $86,600 |
| 2015 | $4,197 | $196,600 | $110,000 | $86,600 |
| 2014 | $3,844 | $196,600 | $110,000 | $86,600 |
Source: Public Records
Map
Nearby Homes
- 1501 Central
- 118 Sampson Ave
- 217 Hiering Ave Unit 3
- 1515 Boulevard Unit 4
- 1515 Boulevard Unit 24
- 1601 Boulevard Unit B7
- 112 Kearney Ave
- 245 Sampson Ave
- 211 Kearney Ave
- 51 Sampson Ave
- 57 Hiering Ave
- 1215 Boulevard
- 45 Sampson Ave Unit 5
- 122 Fremont Ave
- 202 Fremont Ave Unit 1
- 229 Kearney Ave Unit 2
- 1201 Ocean Blvd
- 53 Carteret Ave
- 307 Sampson Ave
- 52 Kearney Ave
- 132 Sampson Ave Unit 34
- 132 Sampson Ave Unit 34
- 132 Sampson Ave Unit 34
- 132 Sampson Ave Unit 34
- 132 Sampson Ave Unit 34
- 132 Sampson Ave Unit A5
- 132 Sampson Ave Unit 4
- 132 Sampson Ave Unit A2
- 132 Sampson Ave Unit A4
- 128 Sampson Ave
- 126 Sampson Ave
- 131 Hiering Ave Unit 33
- 131 Hiering Ave Unit 33
- 131 Hiering Ave Unit 33
- 131 Hiering Ave Unit 33
- 131 Hiering Ave Unit 33
- 131 Hiering Ave Unit 33
- 131 Hiering Ave Unit B11
- 131 Hiering Ave Unit B9
- 131 Hiering Ave Unit B12