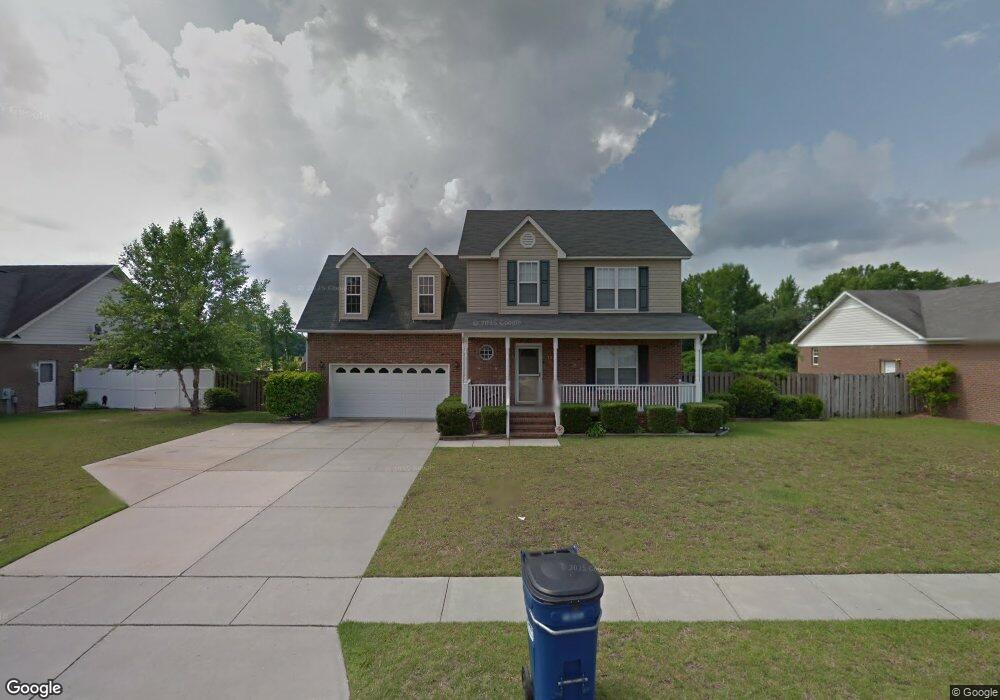
132 Spring Valley Dr Raeford, NC 28376
Estimated Value: $261,000 - $297,000
3
Beds
3
Baths
1,973
Sq Ft
$141/Sq Ft
Est. Value
About This Home
This home is located at 132 Spring Valley Dr, Raeford, NC 28376 and is currently estimated at $279,023, approximately $141 per square foot. 132 Spring Valley Dr is a home located in Hoke County with nearby schools including Scurlock Elementary School, Sandy Grove Middle School, and Hoke County High.
Ownership History
Date
Name
Owned For
Owner Type
Purchase Details
Closed on
Mar 22, 2011
Sold by
Martinez Victor L and Martinez Donna L
Bought by
Simon Tonya R
Current Estimated Value
Home Financials for this Owner
Home Financials are based on the most recent Mortgage that was taken out on this home.
Original Mortgage
$171,000
Outstanding Balance
$118,171
Interest Rate
4.99%
Mortgage Type
VA
Estimated Equity
$160,852
Purchase Details
Closed on
Mar 7, 2011
Sold by
Simon Tonya R and Simon Dwight E
Bought by
Simon Tonya R
Home Financials for this Owner
Home Financials are based on the most recent Mortgage that was taken out on this home.
Original Mortgage
$171,000
Outstanding Balance
$118,171
Interest Rate
4.99%
Mortgage Type
VA
Estimated Equity
$160,852
Purchase Details
Closed on
Nov 3, 2008
Sold by
Sweger Ronny D and Sweger Claudia A
Bought by
Martinez Victor L and Martinez Donna L
Home Financials for this Owner
Home Financials are based on the most recent Mortgage that was taken out on this home.
Original Mortgage
$170,445
Interest Rate
6.11%
Mortgage Type
VA
Create a Home Valuation Report for This Property
The Home Valuation Report is an in-depth analysis detailing your home's value as well as a comparison with similar homes in the area
Home Values in the Area
Average Home Value in this Area
Purchase History
| Date | Buyer | Sale Price | Title Company |
|---|---|---|---|
| Simon Tonya R | $171,000 | -- | |
| Simon Tonya R | -- | -- | |
| Martinez Victor L | $165,000 | None Available |
Source: Public Records
Mortgage History
| Date | Status | Borrower | Loan Amount |
|---|---|---|---|
| Open | Simon Tonya R | $171,000 | |
| Previous Owner | Martinez Victor L | $170,445 |
Source: Public Records
Tax History Compared to Growth
Tax History
| Year | Tax Paid | Tax Assessment Tax Assessment Total Assessment is a certain percentage of the fair market value that is determined by local assessors to be the total taxable value of land and additions on the property. | Land | Improvement |
|---|---|---|---|---|
| 2025 | $1,355 | $196,290 | $21,000 | $175,290 |
| 2024 | $1,720 | $196,290 | $21,000 | $175,290 |
| 2023 | $1,720 | $196,290 | $21,000 | $175,290 |
| 2022 | $1,688 | $196,290 | $21,000 | $175,290 |
| 2021 | $1,576 | $177,820 | $20,000 | $157,820 |
| 2020 | $1,604 | $177,820 | $20,000 | $157,820 |
| 2019 | $1,604 | $177,820 | $20,000 | $157,820 |
| 2018 | $1,604 | $177,820 | $20,000 | $157,820 |
| 2017 | $1,604 | $177,820 | $20,000 | $157,820 |
| 2016 | $1,574 | $177,820 | $20,000 | $157,820 |
| 2015 | $1,538 | $173,300 | $20,000 | $153,300 |
| 2014 | $1,514 | $173,300 | $20,000 | $153,300 |
| 2013 | -- | $153,260 | $22,000 | $131,260 |
Source: Public Records
Map
Nearby Homes
- 136 Mosswood Dr
- 146 Spring Valley Dr
- 236 Heartwood Dr
- 255 Heartwood Dr
- 185 Oakmount Dr
- 409 Mcphail Rd
- 144 Hornet (Lot 47) Dr
- TBD Lot 2 Rockfish Rd
- 0 Rockfish Rd Unit 745922
- Lot 1 Rockfish Rd
- 778 S Parker Church Rd
- 140 Ironwood Way
- 133 Hornet Dr
- 136 Bristol Ct
- 212 Cobra Ln
- 352 Wood Valley Ln
- 235 Chestnut Dr
- 128 Spring Valley Dr
- 134 Spring Valley Dr
- 126 Spring Valley Dr
- 136 Spring Valley Dr
- 190 Heartwood Dr
- 190 Heartwood Dr Unit 152
- 131 Spring Valley Dr
- 129 Spring Valley Dr
- 194 Heartwood Dr
- 137 Spring Valley Dr
- 127 Spring Valley Dr
- 122 Spring Valley Dr
- 140 Spring Valley Dr
- 139 Spring Valley Dr
- 198 Heartwood Dr
- 123 Spring Valley Dr
- 132 Mosswood Dr
- 142 Spring Valley Dr
- 128 Mosswood Dr
- 120 Spring Valley Dr