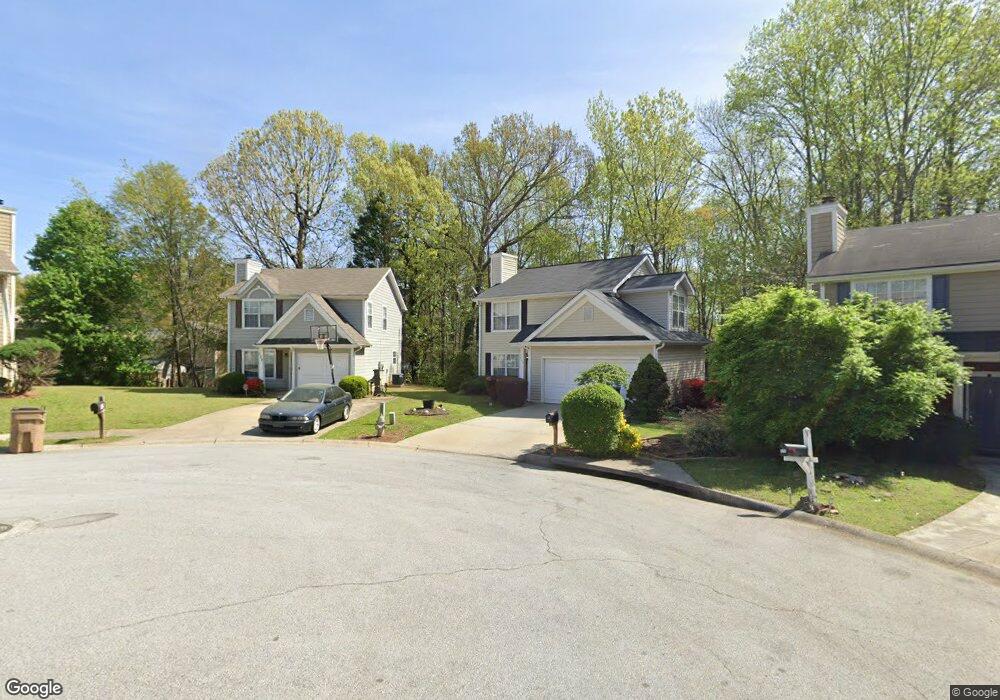
132 Summer Crest Place SW Marietta, GA 30060
Southwestern Marietta NeighborhoodEstimated Value: $313,000 - $351,000
3
Beds
3
Baths
1,268
Sq Ft
$260/Sq Ft
Est. Value
About This Home
This home is located at 132 Summer Crest Place SW, Marietta, GA 30060 and is currently estimated at $329,892, approximately $260 per square foot. 132 Summer Crest Place SW is a home located in Cobb County with nearby schools including LaBelle Elementary School, Smitha Middle School, and Osborne High School.
Ownership History
Date
Name
Owned For
Owner Type
Purchase Details
Closed on
May 3, 2019
Sold by
Arvm 5 Llc
Bought by
Srmz 3 Llc
Current Estimated Value
Purchase Details
Closed on
Dec 5, 2017
Sold by
Wilson Lockhart Sharon R
Bought by
Arvm 5 Llc
Purchase Details
Closed on
Jan 23, 1998
Sold by
Artlip Margaret A
Bought by
Wilson Sharon R
Purchase Details
Closed on
Aug 26, 1993
Sold by
Knight Davidson Co
Bought by
Artlip Margaret A
Home Financials for this Owner
Home Financials are based on the most recent Mortgage that was taken out on this home.
Original Mortgage
$79,300
Interest Rate
6.99%
Mortgage Type
FHA
Create a Home Valuation Report for This Property
The Home Valuation Report is an in-depth analysis detailing your home's value as well as a comparison with similar homes in the area
Home Values in the Area
Average Home Value in this Area
Purchase History
| Date | Buyer | Sale Price | Title Company |
|---|---|---|---|
| Srmz 3 Llc | $458,908 | -- | |
| Arvm 5 Llc | $115,300 | -- | |
| Wilson Sharon R | $95,500 | -- | |
| Artlip Margaret A | $80,600 | -- |
Source: Public Records
Mortgage History
| Date | Status | Borrower | Loan Amount |
|---|---|---|---|
| Previous Owner | Artlip Margaret A | $79,300 | |
| Closed | Wilson Sharon R | -- |
Source: Public Records
Tax History Compared to Growth
Tax History
| Year | Tax Paid | Tax Assessment Tax Assessment Total Assessment is a certain percentage of the fair market value that is determined by local assessors to be the total taxable value of land and additions on the property. | Land | Improvement |
|---|---|---|---|---|
| 2025 | $3,676 | $122,000 | $28,000 | $94,000 |
| 2024 | $3,764 | $124,832 | $28,000 | $96,832 |
| 2023 | $3,035 | $100,672 | $28,000 | $72,672 |
| 2022 | $3,055 | $100,672 | $28,000 | $72,672 |
| 2021 | $2,182 | $71,900 | $28,000 | $43,900 |
| 2020 | $2,188 | $72,088 | $12,000 | $60,088 |
| 2019 | $1,977 | $65,148 | $9,600 | $55,548 |
| 2018 | $1,612 | $53,112 | $9,600 | $43,512 |
| 2017 | $1,527 | $53,112 | $9,600 | $43,512 |
| 2016 | $1,369 | $47,600 | $9,600 | $38,000 |
| 2015 | $1,051 | $35,660 | $9,600 | $26,060 |
| 2014 | $1,059 | $35,660 | $0 | $0 |
Source: Public Records
Map
Nearby Homes
- 152 Summer Lake Dr SW
- 2078 Olive Springs Rd SE
- 2245 Panstone Dr SW
- 166 Zelma St SW
- 2036 Favor Rd SW
- 1809 Austell Rd SW
- 1958 Judy Cir SE
- 1763 Sandtown Rd SW
- 2354 Holly Hill Ct SW
- 1840 Judy Cir SE
- 2177 Wakita Dr SE
- 2379 Olive Springs Rd SE
- 29 Burke St SE
- 2675 Sandtown Rd SW
- 55 Cochran Rd SE
- 1631 Knox Dr SE
- 81 Cochran Rd SE
- 130 Summer Crest Place SW
- 134 Summer Crest Place SW
- 136 Summer Crest Place SW
- 131 Summer Crest Place SW
- 154 Summer Lake Dr SW
- 156 Summer Lake Dr SW
- 150 Summer Lake Dr SW
- 138 Summer Crest Place SW
- 133 Summer Crest Place SW
- 158 Summer Lake Dr SW
- 140 Summer Crest Place SW
- 160 Summer Lake Dr SW
- 2078 Sandtown Rd SW
- 135 Summer Crest Place SW
- 164 Pat Mell Rd SW
- 162 Summer Lake Dr SW
- 2000 Summer Gate Ct SW
- 142 Summer Crest Place SW
- 137 Summer Crest Place SW
- 2001 Summer Gate Ct SW