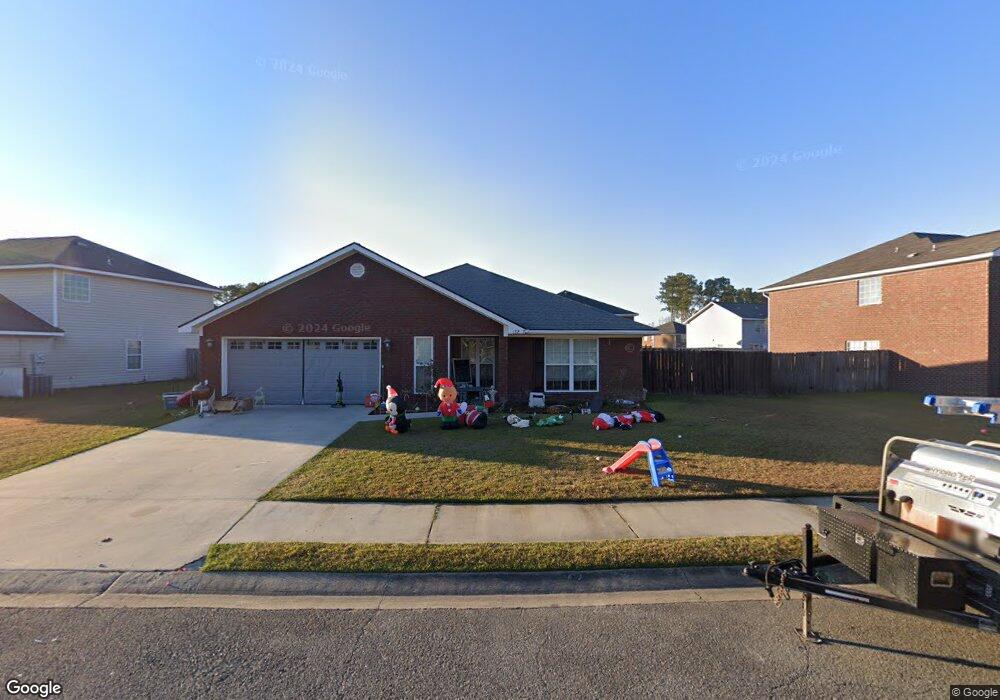
132 Sycamore Way Unit 51 Midway, GA 31320
Estimated Value: $259,883 - $284,000
3
Beds
2
Baths
1,327
Sq Ft
$202/Sq Ft
Est. Value
About This Home
This home is located at 132 Sycamore Way Unit 51, Midway, GA 31320 and is currently estimated at $267,471, approximately $201 per square foot. 132 Sycamore Way Unit 51 is a home located in Liberty County with nearby schools including Liberty Elementary School, Midway Middle School, and Liberty County High School.
Ownership History
Date
Name
Owned For
Owner Type
Purchase Details
Closed on
May 2, 2017
Sold by
Jordan Murphy
Bought by
Williamson Scott Campbell
Current Estimated Value
Home Financials for this Owner
Home Financials are based on the most recent Mortgage that was taken out on this home.
Original Mortgage
$147,283
Outstanding Balance
$124,190
Interest Rate
4.62%
Mortgage Type
FHA
Estimated Equity
$143,281
Purchase Details
Closed on
Dec 2, 2014
Sold by
Favre Brendon J
Bought by
Murphy Jordan and Murphy Caley
Home Financials for this Owner
Home Financials are based on the most recent Mortgage that was taken out on this home.
Original Mortgage
$148,117
Interest Rate
4.09%
Mortgage Type
VA
Purchase Details
Closed on
Apr 22, 2011
Sold by
Dryden Enterprises Inc
Bought by
Favre Brendon J and Favre Amy Lynn
Home Financials for this Owner
Home Financials are based on the most recent Mortgage that was taken out on this home.
Original Mortgage
$145,053
Interest Rate
4.85%
Mortgage Type
VA
Create a Home Valuation Report for This Property
The Home Valuation Report is an in-depth analysis detailing your home's value as well as a comparison with similar homes in the area
Home Values in the Area
Average Home Value in this Area
Purchase History
| Date | Buyer | Sale Price | Title Company |
|---|---|---|---|
| Williamson Scott Campbell | $150,000 | -- | |
| Murphy Jordan | $145,000 | -- | |
| Favre Brendon J | $142,000 | -- |
Source: Public Records
Mortgage History
| Date | Status | Borrower | Loan Amount |
|---|---|---|---|
| Open | Williamson Scott Campbell | $147,283 | |
| Previous Owner | Murphy Jordan | $148,117 | |
| Previous Owner | Favre Brendon J | $145,053 |
Source: Public Records
Tax History Compared to Growth
Tax History
| Year | Tax Paid | Tax Assessment Tax Assessment Total Assessment is a certain percentage of the fair market value that is determined by local assessors to be the total taxable value of land and additions on the property. | Land | Improvement |
|---|---|---|---|---|
| 2024 | $3,869 | $87,293 | $20,000 | $67,293 |
| 2023 | $2,981 | $72,706 | $16,000 | $56,706 |
| 2022 | $2,449 | $62,297 | $16,000 | $46,297 |
| 2021 | $2,187 | $55,718 | $16,000 | $39,718 |
| 2020 | $2,059 | $52,234 | $14,000 | $38,234 |
| 2019 | $2,138 | $52,640 | $14,000 | $38,640 |
| 2018 | $2,129 | $53,047 | $14,000 | $39,047 |
| 2017 | $1,630 | $49,508 | $14,000 | $35,508 |
| 2016 | $1,767 | $49,874 | $14,000 | $35,874 |
| 2015 | $2,110 | $49,874 | $14,000 | $35,874 |
| 2014 | $2,110 | $55,848 | $14,000 | $41,848 |
| 2013 | -- | $52,520 | $14,000 | $38,520 |
Source: Public Records
Map
Nearby Homes
- 99 Caraway Ct
- 41 Kinlock Ct
- 46 Outpost Trail
- 142 Oak Harvest Ridge
- 221 Outpost Trail
- 131 Haven Rd
- 70 1st St
- 24 Jerico Marsh Lot 24 Rd
- 42 Greenwood
- 18 Wild Heron Dr
- 169 Blue Jay Dr
- 0 Oak Ct Unit SA331468
- 0 Oak Ct Unit 160688
- 4 2nd Ave
- 63 Wye Rd
- 85 Wye Rd
- 87 Wye Rd
- 1613 Lake Dr
- 967 Lake Dr
- 1370 Lake Dr
- 132 Sycamore Way
- 112 Sycamore Way
- 148 Sycamore Way
- 247 Manchester Ct
- 98 Sycamore Way Unit n/a
- 98 Sycamore Way
- 166 Sycamore Way
- 259 Manchester Ct
- 115 Sycamore Way
- 221 Manchester Ct
- 143 Sycamore Way
- 84 Sycamore Way
- 157 Sycamore Way
- 103 Sycamore Way
- 182 Sycamore Way
- 273 Manchester Ct
- 171 Sycamore Way
- 207 Manchester Ct
- 11 Powers Dr
- 87 Sycamore Way