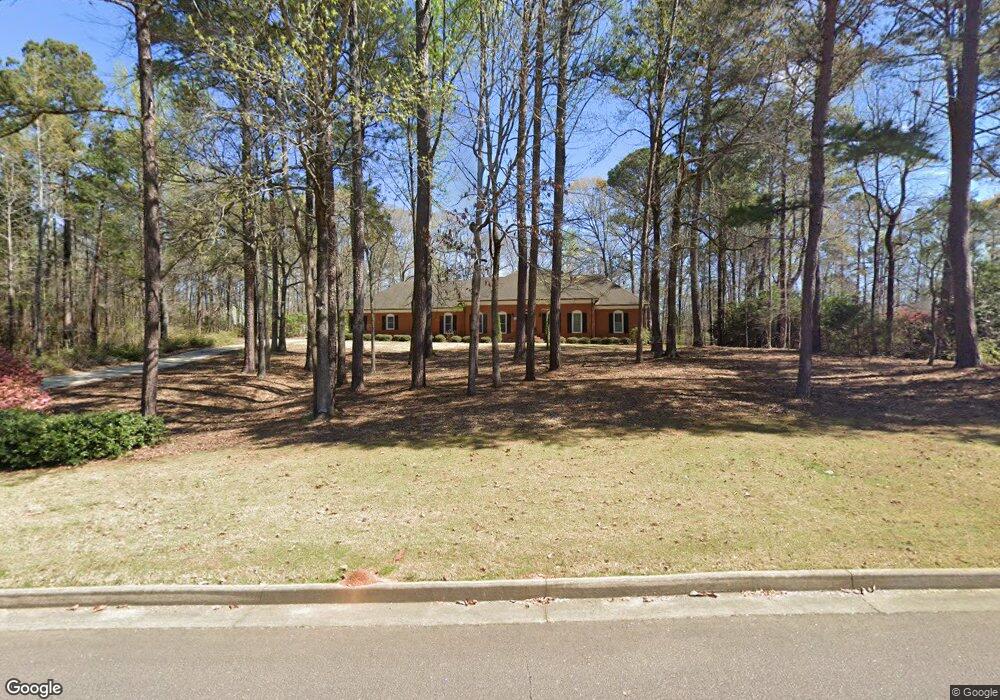
132 Taylor Len Dr Lagrange, GA 30240
Estimated Value: $372,000 - $410,000
4
Beds
4
Baths
2,722
Sq Ft
$144/Sq Ft
Est. Value
About This Home
This home is located at 132 Taylor Len Dr, Lagrange, GA 30240 and is currently estimated at $391,754, approximately $143 per square foot. 132 Taylor Len Dr is a home located in Troup County with nearby schools including Hillcrest Elementary School, Franklin Forest Elementary School, and Hollis Hand Elementary School.
Ownership History
Date
Name
Owned For
Owner Type
Purchase Details
Closed on
Mar 10, 2017
Sold by
Schumacher James
Bought by
Bittick Newton H and Bittick Jennifer H
Current Estimated Value
Home Financials for this Owner
Home Financials are based on the most recent Mortgage that was taken out on this home.
Original Mortgage
$144,500
Outstanding Balance
$118,670
Interest Rate
4.17%
Mortgage Type
New Conventional
Estimated Equity
$273,084
Purchase Details
Closed on
Oct 30, 2012
Sold by
Schumacher James
Bought by
Schumacher James and Schumacher Bonnie
Home Financials for this Owner
Home Financials are based on the most recent Mortgage that was taken out on this home.
Original Mortgage
$195,395
Interest Rate
3.4%
Mortgage Type
Reverse Mortgage Home Equity Conversion Mortgage
Purchase Details
Closed on
Aug 20, 1993
Sold by
Al Bennett
Bought by
Mcclain William M and Mcclain Karen W
Purchase Details
Closed on
Jun 14, 1990
Bought by
Al Bennett
Purchase Details
Closed on
Mar 1, 1989
Create a Home Valuation Report for This Property
The Home Valuation Report is an in-depth analysis detailing your home's value as well as a comparison with similar homes in the area
Purchase History
| Date | Buyer | Sale Price | Title Company |
|---|---|---|---|
| Bittick Newton H | $193,300 | -- | |
| Schumacher James | -- | -- | |
| Schumacher James | $199,000 | -- | |
| Mcclain William M | $152,900 | -- | |
| Al Bennett | $148,000 | -- | |
| -- | $135,000 | -- | |
| -- | $135,000 | -- |
Source: Public Records
Mortgage History
| Date | Status | Borrower | Loan Amount |
|---|---|---|---|
| Open | Bittick Newton H | $144,500 | |
| Previous Owner | Schumacher James | $195,395 |
Source: Public Records
Tax History
| Year | Tax Paid | Tax Assessment Tax Assessment Total Assessment is a certain percentage of the fair market value that is determined by local assessors to be the total taxable value of land and additions on the property. | Land | Improvement |
|---|---|---|---|---|
| 2025 | $3,535 | $149,200 | $16,800 | $132,400 |
| 2024 | $3,535 | $131,600 | $16,800 | $114,800 |
| 2023 | $3,364 | $125,320 | $12,000 | $113,320 |
| 2022 | $3,247 | $118,320 | $12,000 | $106,320 |
| 2021 | $2,628 | $89,120 | $12,000 | $77,120 |
| 2020 | $2,628 | $89,120 | $12,000 | $77,120 |
| 2019 | $2,586 | $87,720 | $8,000 | $79,720 |
| 2018 | $2,272 | $87,720 | $8,000 | $79,720 |
| 2016 | $2,611 | $86,578 | $8,000 | $78,578 |
| 2015 | $2,616 | $86,578 | $8,000 | $78,578 |
| 2014 | $2,547 | $84,160 | $8,000 | $76,160 |
| 2013 | -- | $88,628 | $8,000 | $80,628 |
Source: Public Records
Map
Nearby Homes
- 103 Ford Dr
- 114 Taylor Len Dr
- 143 Taylor Len Dr
- 160 Lakemont Dr
- 178 Waterview Dr
- 113 Wellington Dr
- 111 Copper Creek Dr
- 1006 Wares Cross Rd
- 589 Waterview Dr
- 24 N Brooks Rd
- 0 Waterview Dr Unit 10558462
- 219 E Yorktown Dr
- 64 Waterview Ct
- 4555 Mooty Bridge Rd
- 57 Hubbard Rd
- 206 Sturbridge Dr
- 42 Wooding Place
- 0 River Club Dr Unit 10311961
- 223 Village Dr
- 183 Indian Bend Dr
- 130 Taylor Len Dr
- 136 Taylor Len Dr
- 128 Taylor Len Dr
- 123 Taylor Len Dr
- 125 Taylor Len Dr
- 127 Taylor Len Dr
- 129 Taylor Len Dr
- 119 Taylor Len Dr
- 126 Taylor Len Dr
- 133 Taylor Len Dr
- 117 Taylor Len Dr
- 146 Taylor Len Dr
- 124 Taylor Len Dr
- 106 Ford Dr
- 115 Taylor Len Dr
- 135 Taylor Len Dr
- 108 Ford Dr
- 137 Taylor Len Dr Unit 64
- 137 Taylor Len Dr
- 102 Ford Dr