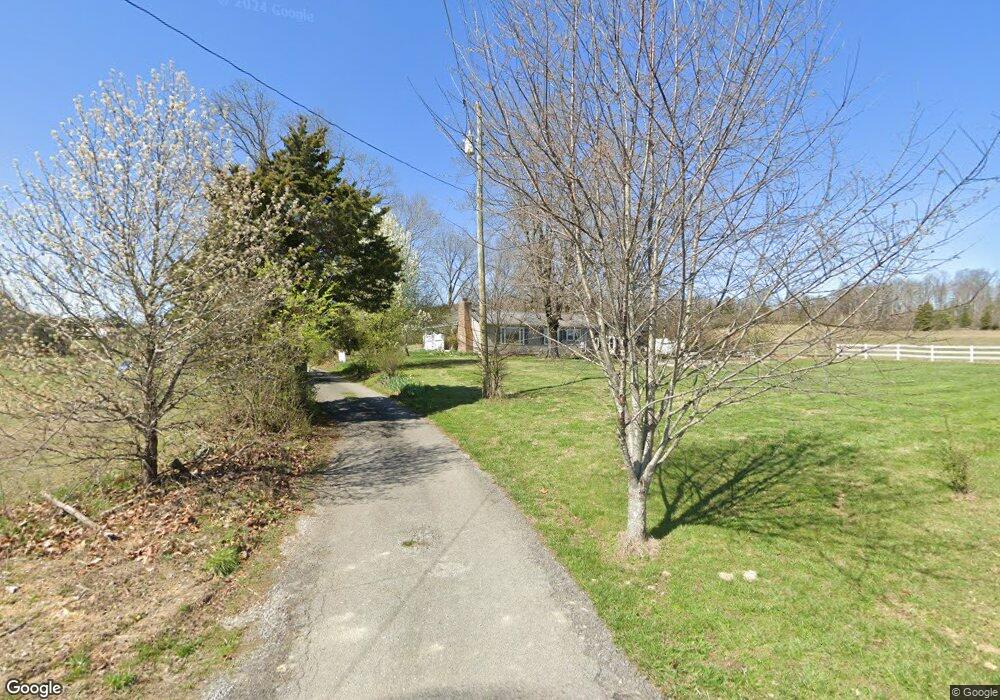
132 Twin Oaks Rd Sweetwater, TN 37874
Estimated Value: $349,000 - $441,139
3
Beds
1
Bath
1,276
Sq Ft
$306/Sq Ft
Est. Value
About This Home
This home is located at 132 Twin Oaks Rd, Sweetwater, TN 37874 and is currently estimated at $390,535, approximately $306 per square foot. 132 Twin Oaks Rd is a home located in Monroe County with nearby schools including Sweetwater Primary School, Sweetwater Elementary School, and Brown Intermediate School.
Ownership History
Date
Name
Owned For
Owner Type
Purchase Details
Closed on
May 28, 2020
Sold by
Odoherty Brendan S
Bought by
Goddard Traci
Current Estimated Value
Purchase Details
Closed on
Oct 4, 2016
Sold by
Hammontree Earl B
Bought by
Odoherty Traci L and Odoherty Brendan S
Home Financials for this Owner
Home Financials are based on the most recent Mortgage that was taken out on this home.
Original Mortgage
$164,326
Outstanding Balance
$130,493
Interest Rate
3.25%
Mortgage Type
FHA
Estimated Equity
$260,042
Purchase Details
Closed on
Aug 26, 2011
Sold by
Miller Jeanette
Bought by
Hammontree Earl B and Hammontree Frances J
Purchase Details
Closed on
Jul 5, 1994
Sold by
Donnie Harrison
Bought by
Jeanette Miller
Purchase Details
Closed on
May 23, 1994
Bought by
Miller Jeanette
Purchase Details
Closed on
Oct 25, 1966
Purchase Details
Closed on
Oct 24, 1966
Purchase Details
Closed on
Sep 9, 1949
Bought by
Harrison Donna P
Purchase Details
Closed on
Oct 29, 1945
Create a Home Valuation Report for This Property
The Home Valuation Report is an in-depth analysis detailing your home's value as well as a comparison with similar homes in the area
Home Values in the Area
Average Home Value in this Area
Purchase History
| Date | Buyer | Sale Price | Title Company |
|---|---|---|---|
| Goddard Traci | -- | None Available | |
| Odoherty Traci L | $170,000 | -- | |
| Hammontree Earl B | $220,000 | -- | |
| Jeanette Miller | -- | -- | |
| Miller Jeanette | $46,900 | -- | |
| -- | -- | -- | |
| -- | -- | -- | |
| Harrison Donna P | -- | -- | |
| -- | -- | -- |
Source: Public Records
Mortgage History
| Date | Status | Borrower | Loan Amount |
|---|---|---|---|
| Open | Odoherty Traci L | $164,326 |
Source: Public Records
Tax History Compared to Growth
Tax History
| Year | Tax Paid | Tax Assessment Tax Assessment Total Assessment is a certain percentage of the fair market value that is determined by local assessors to be the total taxable value of land and additions on the property. | Land | Improvement |
|---|---|---|---|---|
| 2025 | $739 | $48,500 | $0 | $0 |
| 2024 | $739 | $48,500 | $15,250 | $33,250 |
| 2023 | $739 | $48,500 | $15,250 | $33,250 |
| 2022 | $1,243 | $55,500 | $35,525 | $19,975 |
| 2021 | $597 | $32,500 | $12,525 | $19,975 |
| 2020 | $597 | $26,650 | $12,525 | $14,125 |
| 2019 | $528 | $26,650 | $12,525 | $14,125 |
| 2018 | $528 | $26,650 | $12,525 | $14,125 |
| 2017 | $482 | $23,025 | $12,175 | $10,850 |
| 2016 | $482 | $43,650 | $32,825 | $10,825 |
| 2015 | $482 | $23,000 | $12,175 | $10,825 |
| 2014 | $481 | $22,976 | $0 | $0 |
Source: Public Records
Map
Nearby Homes
- 2049 Highway 322 E
- 2039 Highway 322 E
- 2399 Sweetwater Vonore Rd
- 180 Webb Rd
- 267 Glenlock Rd
- 2098 Sweetwater Vonore Rd
- 224 Red Pond Rd
- 313 Burton Rd
- 2511 Sweetwater Vonore Rd
- 417 Oakhill Dr
- 795 Hawkins Rd
- 145 Linwood Dr
- 487 Fish Hatchery Rd
- 122 H St
- 311 Linwood Dr
- 210 Sunset Dr
- 408 Kinzalow Dr
- 00 Kinzalow Cir
- 000 Kinzalow Cir
- 309 Kinzalow Dr
- 132 Twin Oaks Rd
- 132 Twin Oaks Rd
- 2051 Highway 322 E
- 123 Twin Oaks Rd
- 0 Highway 322 Unit 675352
- 0 Highway 322 Unit 675351
- 0 Highway 322 Unit 694081
- 0 Highway 322 Unit 694080
- 107 Twin Oaks Rd
- 113 Glenlock Rd
- 2047 Highway 322 E
- 2043 Highway 322 E
- 127 Glenlock Rd
- 145 Twin Oaks Rd
- 145 Twin Oaks Rd
- 210 Glenlock Rd
- 2039 Tennessee 322
- 2039 Hwy 322 E
- 220 Glenlock Rd
- 224 Glenlock Rd