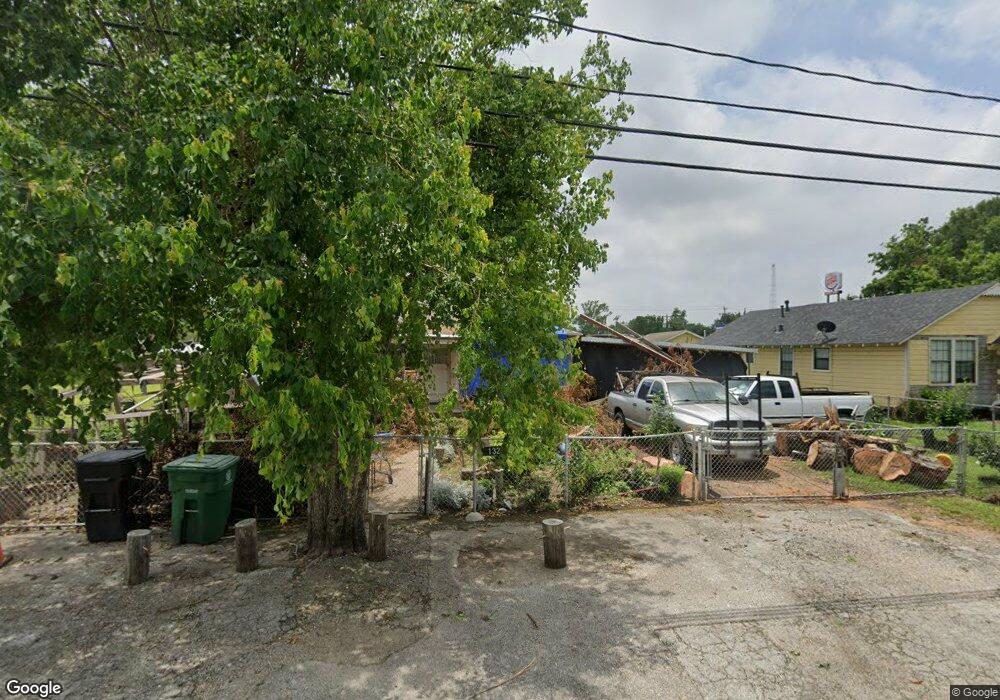
132 Van Molan St Houston, TX 77022
Northside-Northline NeighborhoodEstimated Value: $158,792 - $199,000
2
Beds
1
Bath
920
Sq Ft
$199/Sq Ft
Est. Value
About This Home
This home is located at 132 Van Molan St, Houston, TX 77022 and is currently estimated at $183,198, approximately $199 per square foot. 132 Van Molan St is a home located in Harris County with nearby schools including Janowski Elementary School, Burbank Middle School, and Sam Houston Math, Science & Technology Center.
Ownership History
Date
Name
Owned For
Owner Type
Purchase Details
Closed on
Dec 11, 1998
Sold by
Robert W Wilson Inc
Bought by
Gonzales Guadalupe
Current Estimated Value
Home Financials for this Owner
Home Financials are based on the most recent Mortgage that was taken out on this home.
Original Mortgage
$42,750
Outstanding Balance
$9,736
Interest Rate
6.81%
Estimated Equity
$173,462
Purchase Details
Closed on
Aug 27, 1998
Sold by
Garza Eluterio R
Bought by
Robert W Wilson Inc
Create a Home Valuation Report for This Property
The Home Valuation Report is an in-depth analysis detailing your home's value as well as a comparison with similar homes in the area
Home Values in the Area
Average Home Value in this Area
Purchase History
| Date | Buyer | Sale Price | Title Company |
|---|---|---|---|
| Gonzales Guadalupe | -- | Stewart Title | |
| Robert W Wilson Inc | -- | Texas American Title Company |
Source: Public Records
Mortgage History
| Date | Status | Borrower | Loan Amount |
|---|---|---|---|
| Open | Gonzales Guadalupe | $42,750 |
Source: Public Records
Tax History Compared to Growth
Tax History
| Year | Tax Paid | Tax Assessment Tax Assessment Total Assessment is a certain percentage of the fair market value that is determined by local assessors to be the total taxable value of land and additions on the property. | Land | Improvement |
|---|---|---|---|---|
| 2025 | $2,679 | $173,101 | $123,500 | $49,601 |
| 2024 | $2,679 | $163,361 | $113,344 | $50,017 |
| 2023 | $2,679 | $146,414 | $69,063 | $77,351 |
| 2022 | $2,661 | $129,681 | $69,063 | $60,618 |
| 2021 | $2,561 | $114,734 | $69,063 | $45,671 |
| 2020 | $2,419 | $109,959 | $69,063 | $40,896 |
| 2019 | $2,298 | $100,042 | $56,875 | $43,167 |
| 2018 | $166 | $82,555 | $47,531 | $35,024 |
| 2017 | $1,906 | $82,555 | $47,531 | $35,024 |
| 2016 | $1,733 | $83,383 | $44,688 | $38,695 |
| 2015 | $237 | $62,289 | $32,500 | $29,789 |
| 2014 | $237 | $62,289 | $32,500 | $29,789 |
Source: Public Records
Map
Nearby Homes
- 210 Van Molan St
- 245 Palmyra St
- 121-123 Van Molan St
- 212B Garrotsville St
- 212A Garrotsville St
- 0 Yorkshire St Unit 17401015
- 715 E 34th St
- 0 E 31st St Unit 75519178
- 0 W Hardy St Unit 97848877
- 0 W Hardy St Unit 80694202
- 3111 Eastman St
- 7523 Roswell St
- 7315 Roswell St
- 7317 Roswell St
- 7311 Roswell St
- 246 Rebecca St
- 120 Rebecca St
- 65 Neyland St
- 7111 Bauman Rd
- 136 Theron St
- 128 Van Molan St
- 126 Van Molan St
- 212 Van Molan St
- 125 Van Molan St
- 133 Van Molan St
- 137 Van Molan St
- 120 Van Molan St
- 209 E Crosstimbers St
- 139 Van Molan St
- 218 Van Molan St
- 213 Van Molan St
- 117 Van Molan St
- 220 Van Molan St
- 110 Van Molan St
- 215 Van Molan St
- 204 Palmyra St
- 208 Palmyra St
- 222 Van Molan St
- 210 Palmyra St
- 124 Palmyra St