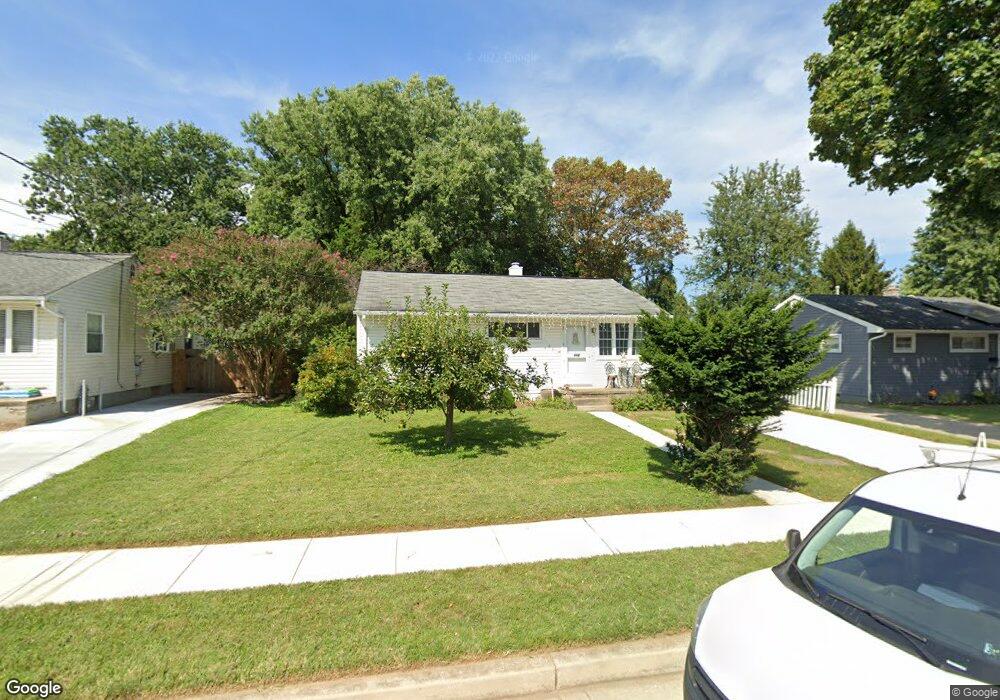
132 Wilgate Rd Owings Mills, MD 21117
Estimated Value: $299,000 - $316,000
--
Bed
1
Bath
1,254
Sq Ft
$246/Sq Ft
Est. Value
About This Home
This home is located at 132 Wilgate Rd, Owings Mills, MD 21117 and is currently estimated at $308,419, approximately $245 per square foot. 132 Wilgate Rd is a home located in Baltimore County with nearby schools including Owings Mills Elementary School, Deer Park Middle Magnet School, and Owings Mills High School.
Ownership History
Date
Name
Owned For
Owner Type
Purchase Details
Closed on
Mar 28, 2025
Sold by
Baumgartner Glenn P and Eisenstein Patsy Kuo
Bought by
Avalos Patricia Yessenia and Avalos Alisson Stefany
Current Estimated Value
Home Financials for this Owner
Home Financials are based on the most recent Mortgage that was taken out on this home.
Original Mortgage
$294,566
Outstanding Balance
$293,264
Interest Rate
6.67%
Mortgage Type
FHA
Estimated Equity
$15,155
Purchase Details
Closed on
Aug 22, 2007
Sold by
Baumgartner Paul E
Bought by
Baumgartner Glenn P and Eisenstein Weiting K
Purchase Details
Closed on
Aug 6, 2007
Sold by
Baumgartner Paul E
Bought by
Baumgartner Glenn P and Eisenstein Weiting K
Purchase Details
Closed on
Jun 28, 1993
Sold by
Snyder Thomas L
Bought by
Baumgartner Paul E
Purchase Details
Closed on
Apr 19, 1966
Sold by
Mager Joseph P
Bought by
Snyder Thomas L
Create a Home Valuation Report for This Property
The Home Valuation Report is an in-depth analysis detailing your home's value as well as a comparison with similar homes in the area
Home Values in the Area
Average Home Value in this Area
Purchase History
| Date | Buyer | Sale Price | Title Company |
|---|---|---|---|
| Avalos Patricia Yessenia | $300,000 | None Listed On Document | |
| Avalos Patricia Yessenia | $300,000 | None Listed On Document | |
| Baumgartner Glenn P | -- | -- | |
| Baumgartner Glenn P | -- | -- | |
| Baumgartner Paul E | $102,000 | -- | |
| Snyder Thomas L | $14,600 | -- |
Source: Public Records
Mortgage History
| Date | Status | Borrower | Loan Amount |
|---|---|---|---|
| Open | Avalos Patricia Yessenia | $294,566 | |
| Closed | Avalos Patricia Yessenia | $294,566 |
Source: Public Records
Tax History Compared to Growth
Tax History
| Year | Tax Paid | Tax Assessment Tax Assessment Total Assessment is a certain percentage of the fair market value that is determined by local assessors to be the total taxable value of land and additions on the property. | Land | Improvement |
|---|---|---|---|---|
| 2025 | $2,953 | $222,700 | -- | -- |
| 2024 | $2,953 | $200,600 | $52,000 | $148,600 |
| 2023 | $1,437 | $196,233 | $0 | $0 |
| 2022 | $2,723 | $191,867 | $0 | $0 |
| 2021 | $2,488 | $187,500 | $52,000 | $135,500 |
| 2020 | $2,488 | $177,567 | $0 | $0 |
| 2019 | $2,427 | $167,633 | $0 | $0 |
| 2018 | $2,341 | $157,700 | $42,000 | $115,700 |
| 2017 | $2,152 | $150,100 | $0 | $0 |
| 2016 | $2,174 | $142,500 | $0 | $0 |
| 2015 | $2,174 | $134,900 | $0 | $0 |
| 2014 | $2,174 | $134,900 | $0 | $0 |
Source: Public Records
Map
Nearby Homes
- 153 Wilgate Rd
- 37 Wengate Rd
- 60 S Ritters Ln
- 156 S Ritters Ln
- 305 Wyndham Cir Unit 305K
- 3 Chins Ct
- 19 Pleasant Hill Rd
- 32 Pleasant Hill Rd
- 5109 Gold Hill Rd
- 346 Paladium Ct
- 372 Paladium Ct
- 9537 Tessa Ln
- 1067 Campbell Meadow Rd
- 9339 Paragon Way
- 34 Hawk Rise Ln
- 900 Red Brook Blvd Unit 101
- 18 Hawk Rise Ln Unit 205
- 16 Hawk Rise Ln
- 9473 Ashlyn Cir
- 9716 Ashlyn Cir
- 134 Wilgate Rd
- 130 Wilgate Rd
- 136 Wilgate Rd
- 128 Wilgate Rd
- 138 Wilgate Rd
- 124 Wilgate Rd
- 131 Wilgate Rd
- 133 Wilgate Rd
- 121 S Ritters Ln
- 123 S Ritters Ln
- 135 Wilgate Rd
- 119 S Ritters Ln
- 137 Wilgate Rd
- 129 Wilgate Rd
- 140 Wilgate Rd
- 122 Wilgate Rd
- 117 S Ritters Ln
- 127 Wilgate Rd
- 139 Wilgate Rd
- 105 Highgate Ct