Estimated Value: $142,752 - $206,000
--
Bed
--
Bath
1,209
Sq Ft
$146/Sq Ft
Est. Value
About This Home
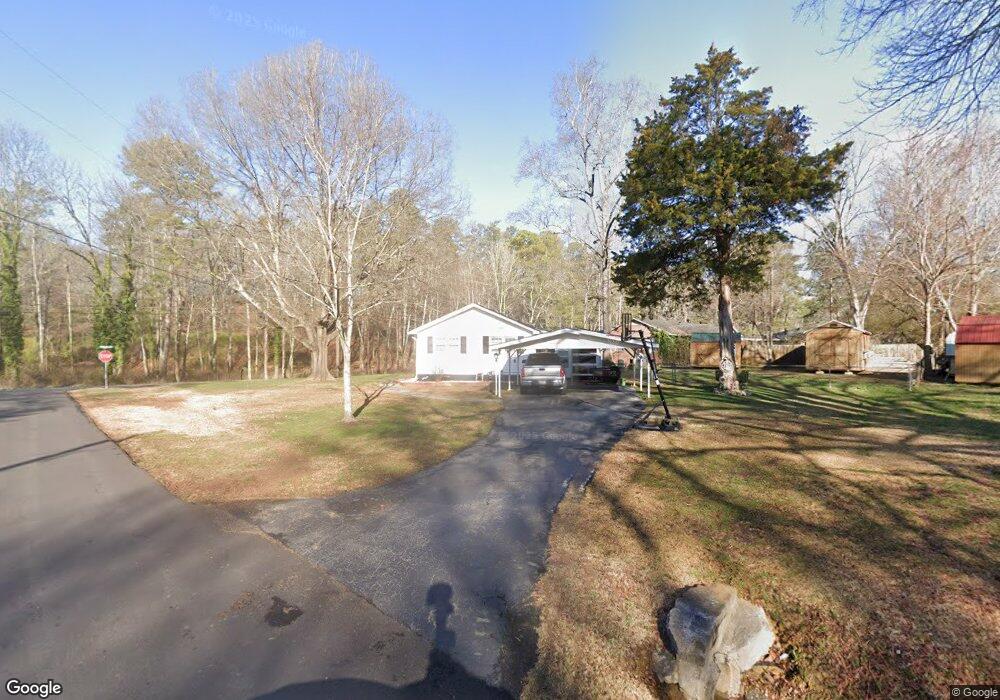
This home is located at 132 Wilshire Rd NE, Rome, GA 30161 and is currently estimated at $176,688, approximately $146 per square foot. 132 Wilshire Rd NE is a home located in Floyd County with nearby schools including Model Middle School, Model High School, and Unity Christian School.
Ownership History
Date
Name
Owned For
Owner Type
Purchase Details
Closed on
Dec 12, 2008
Bought by
P and R
Current Estimated Value
Purchase Details
Closed on
Nov 23, 2004
Sold by
Mathis Thomas A and Mathis Joann C
Bought by
Henderson Jeffery Nicholas
Purchase Details
Closed on
Nov 14, 1986
Sold by
Scott Allen D and Scott Lucille M
Bought by
Mathis Thomas A and Mathis Joann C
Purchase Details
Closed on
Jul 26, 1985
Sold by
Burns Eugene and Burns Shirley
Bought by
Scott Allen D and Scott Lucille M
Purchase Details
Closed on
Jun 28, 1983
Sold by
Selman Jerry Thomas
Bought by
Burns Eugene and Burns Shirley
Purchase Details
Closed on
Mar 5, 1976
Sold by
Puryear Puryear S and Puryear Doris
Bought by
Selman Jerry Thomas
Purchase Details
Closed on
Aug 23, 1965
Sold by
Federal Housing Commissioner
Bought by
Puryear Puryear S and Puryear Doris
Purchase Details
Closed on
Nov 12, 1964
Sold by
Young George E
Bought by
Federal Housing Commissioner
Purchase Details
Closed on
Oct 11, 1964
Bought by
P and R
Purchase Details
Closed on
Oct 12, 1960
Bought by
Young George E
Create a Home Valuation Report for This Property
The Home Valuation Report is an in-depth analysis detailing your home's value as well as a comparison with similar homes in the area
Home Values in the Area
Average Home Value in this Area
Purchase History
| Date | Buyer | Sale Price | Title Company |
|---|---|---|---|
| P | -- | -- | |
| Henderson Jeffery Nicholas | $73,000 | -- | |
| Mathis Thomas A | $30,000 | -- | |
| Scott Allen D | $27,000 | -- | |
| Burns Eugene | $32,000 | -- | |
| Selman Jerry Thomas | $21,000 | -- | |
| Puryear Puryear S | $12,000 | -- | |
| Federal Housing Commissioner | $11,400 | -- | |
| P | -- | -- | |
| Young George E | -- | -- |
Source: Public Records
Tax History Compared to Growth
Tax History
| Year | Tax Paid | Tax Assessment Tax Assessment Total Assessment is a certain percentage of the fair market value that is determined by local assessors to be the total taxable value of land and additions on the property. | Land | Improvement |
|---|---|---|---|---|
| 2024 | $1,130 | $53,545 | $7,915 | $45,630 |
| 2023 | $988 | $44,306 | $6,984 | $37,322 |
| 2022 | $827 | $33,817 | $5,587 | $28,230 |
| 2021 | $752 | $29,251 | $5,587 | $23,664 |
| 2020 | $696 | $26,067 | $4,423 | $21,644 |
| 2019 | $642 | $24,557 | $4,423 | $20,134 |
| 2018 | $599 | $23,098 | $4,423 | $18,675 |
| 2017 | $573 | $22,193 | $4,423 | $17,770 |
| 2016 | $561 | $21,564 | $4,400 | $17,164 |
| 2015 | $575 | $20,764 | $4,400 | $16,364 |
| 2014 | $575 | $21,808 | $4,400 | $17,408 |
Source: Public Records
Map
Nearby Homes
- 0 Doncaster Dr NE Unit 10293320
- 16 Barnesdale Way NE
- 0 Carrington Place NE Unit 7512224
- 0 Carrington Place NE Unit 10443994
- 26 Greer Dr NE
- 1 Lionel Ct NE
- 6 Tahlequah St NE
- 22 Robin Hood Rd NE
- 108 Dekle Dr NE
- 109 Dekle Dr NE
- 127 Jim Lee Dr NE
- 45 Bannister Dr NE
- 7 Hillcrest Ave NE
- 13 E Lakeshore Dr SE
- 1306 Calhoun Ave NE
- 0 Lakeshore Dr
- 14 Mitchell Cir SE
- 9 Heather Rd SE
- 206 Maplecrest Ln SE
- 2005 Highland Cir NE
- 134 Wilshire Rd NE
- 1 Nottingham Way NE
- 2 Pembroke Place NE
- 3 Nottingham Way NE
- 136 Wilshire Rd NE
- 4 Pembroke Place NE
- 126 Wilshire Rd NE
- 5 Nottingham Way NE
- 3 Nottingham Ct NE
- 2 Nottingham Way NE
- 4 Nottingham Way NE
- 124 Wilshire Rd NE
- 140 Wilshire Rd NE
- 27 Doncaster Dr NE
- 29 Doncaster Dr NE
- 5 Nottingham Ct NE
- 25 Doncaster Dr NE
- 33 Doncaster Dr NE
- 122 Wilshire Rd NE
- 9 Nottingham Way NE