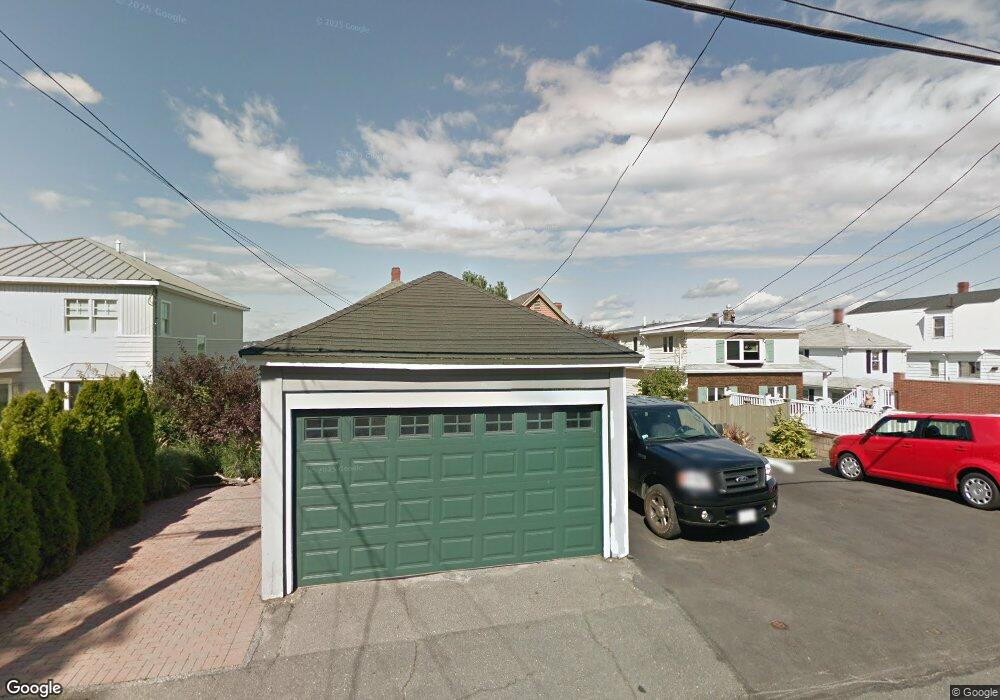
132 Wilson Rd Nahant, MA 01908
Estimated Value: $1,009,964 - $1,247,000
3
Beds
3
Baths
1,918
Sq Ft
$594/Sq Ft
Est. Value
About This Home
This home is located at 132 Wilson Rd, Nahant, MA 01908 and is currently estimated at $1,140,241, approximately $594 per square foot. 132 Wilson Rd is a home located in Essex County with nearby schools including Johnson Elementary School, Swampscott Middle School, and Swampscott High School.
Ownership History
Date
Name
Owned For
Owner Type
Purchase Details
Closed on
Aug 14, 2017
Sold by
Edith A Roland T A and Edith Roland
Bought by
Edith A Roland Irt and Cantalini
Current Estimated Value
Purchase Details
Closed on
Jul 8, 2005
Sold by
Mucci Jon S
Bought by
132 Wilson Rd Rt and Roland
Create a Home Valuation Report for This Property
The Home Valuation Report is an in-depth analysis detailing your home's value as well as a comparison with similar homes in the area
Home Values in the Area
Average Home Value in this Area
Purchase History
| Date | Buyer | Sale Price | Title Company |
|---|---|---|---|
| Edith A Roland Irt | -- | -- | |
| Edith A Roland Irt | -- | -- | |
| 132 Wilson Rd Rt | $585,000 | -- | |
| 132 Wilson Rd Rt | $585,000 | -- |
Source: Public Records
Tax History Compared to Growth
Tax History
| Year | Tax Paid | Tax Assessment Tax Assessment Total Assessment is a certain percentage of the fair market value that is determined by local assessors to be the total taxable value of land and additions on the property. | Land | Improvement |
|---|---|---|---|---|
| 2025 | $9,759 | $1,066,600 | $644,100 | $422,500 |
| 2024 | $9,290 | $1,024,300 | $603,800 | $420,500 |
| 2023 | $8,322 | $915,500 | $531,400 | $384,100 |
| 2022 | $8,134 | $830,800 | $483,100 | $347,700 |
| 2021 | $8,098 | $770,500 | $442,800 | $327,700 |
| 2020 | $7,973 | $726,800 | $442,800 | $284,000 |
| 2019 | $7,193 | $659,300 | $402,500 | $256,800 |
| 2018 | $6,289 | $613,600 | $362,300 | $251,300 |
| 2017 | $6,424 | $613,600 | $362,300 | $251,300 |
| 2016 | $6,158 | $585,400 | $346,200 | $239,200 |
| 2015 | $6,124 | $560,800 | $321,600 | $239,200 |
| 2014 | $5,861 | $531,400 | $292,200 | $239,200 |
Source: Public Records
Map
Nearby Homes
- 36 Lennox Rd
- 9 Little Nahant Rd
- 23 Phillips Rd
- 66 Ocean St
- 17 Pearl Rd
- 43 Maple Ave
- 2 Goddard Dr
- 303 Nahant Rd
- 183 Bass Point Rd
- 51 Cliff St
- 9 Beach Rd Unit 4
- 98 Lynnway Unit 102
- 12 Chancery Ct Unit 205
- 12 Chancery Ct Unit 207
- 45 Tudor St Unit 3-8
- 41 Tudor St
- 3 Cliff St
- 154 Lynnway Unit 520
- 154 Lynnway Unit 205
- 154 Lynnway Unit 213
- 126 Wilson Rd
- 136 Wilson Rd
- 136 Wilson Rd Unit B
- 138 Wilson Rd
- 138 Wilson Rd Unit 1
- 122 Wilson Rd
- 144 Wilson Rd
- 118 Wilson Rd
- 133 Wilson Rd Unit House
- 133 Wilson Rd
- 133 Wilson Rd Unit LL
- 148 Wilson Rd
- 110 Wilson Rd
- 131 Wilson Rd
- 131 Wilson Rd Unit 3
- 131 Wilson Rd Unit 2
- 131 Wilson Rd Unit 1
- 129 Wilson Rd
- 129A Wilson Rd
- 129A Wilson Rd