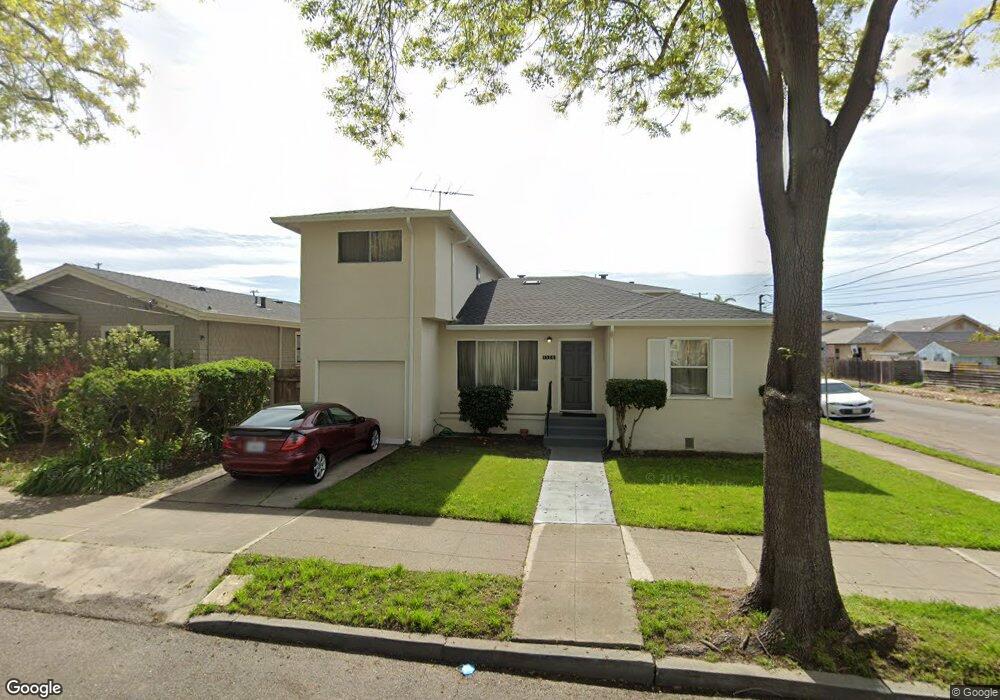
1320 66th St Berkeley, CA 94702
West Berkeley NeighborhoodEstimated Value: $1,073,000 - $1,492,881
9
Beds
5
Baths
3,148
Sq Ft
$412/Sq Ft
Est. Value
About This Home
This home is located at 1320 66th St, Berkeley, CA 94702 and is currently estimated at $1,295,970, approximately $411 per square foot. 1320 66th St is a home located in Alameda County with nearby schools including Malcolm X Elementary School, Washington Elementary School, and Oxford Elementary School.
Ownership History
Date
Name
Owned For
Owner Type
Purchase Details
Closed on
Dec 17, 1996
Sold by
Lawson John
Bought by
Turner Len D and Turner Terez V
Current Estimated Value
Purchase Details
Closed on
Apr 28, 1995
Sold by
Phillips Helen
Bought by
Phillips Zelda and Phillips Helen
Create a Home Valuation Report for This Property
The Home Valuation Report is an in-depth analysis detailing your home's value as well as a comparison with similar homes in the area
Home Values in the Area
Average Home Value in this Area
Purchase History
| Date | Buyer | Sale Price | Title Company |
|---|---|---|---|
| Turner Len D | $260,000 | Fidelity National Title Co | |
| Phillips Zelda | -- | -- |
Source: Public Records
Tax History
| Year | Tax Paid | Tax Assessment Tax Assessment Total Assessment is a certain percentage of the fair market value that is determined by local assessors to be the total taxable value of land and additions on the property. | Land | Improvement |
|---|---|---|---|---|
| 2025 | $6,915 | $112,646 | $44,867 | $74,779 |
| 2024 | $6,915 | $110,301 | $43,988 | $73,313 |
| 2023 | $6,716 | $115,000 | $43,125 | $71,875 |
| 2022 | $6,470 | $105,746 | $42,280 | $70,466 |
| 2021 | $6,399 | $103,536 | $41,451 | $69,085 |
| 2020 | $5,746 | $109,403 | $41,026 | $68,377 |
| 2019 | $5,181 | $107,257 | $40,221 | $67,036 |
| 2018 | $5,021 | $105,155 | $39,433 | $65,722 |
| 2017 | $4,800 | $103,093 | $38,660 | $64,433 |
| 2016 | $4,421 | $101,072 | $37,902 | $63,170 |
| 2015 | $4,330 | $99,553 | $37,332 | $62,221 |
| 2014 | $4,479 | $97,603 | $36,601 | $61,002 |
Source: Public Records
Map
Nearby Homes
- 6628 Helen Ct
- 1080 67th St
- 3032 Mabel St
- 3224 Sacramento St
- 6500 San Pablo Ave
- 3101 Sacramento St
- 1314 Ashby Ave
- 1507 Prince St
- 6501 San Pablo Ave Unit 410
- 6465 San Pablo Ave Unit 203
- 1126 Ocean Ave
- 3138 California St
- 968 62nd St
- 3114 California St
- 3214 California St
- 3110 California St
- 1237 Ashby Ave
- 2922 Stanton St
- 1164 Ocean Ave
- 1124 63rd St
Your Personal Tour Guide
Ask me questions while you tour the home.