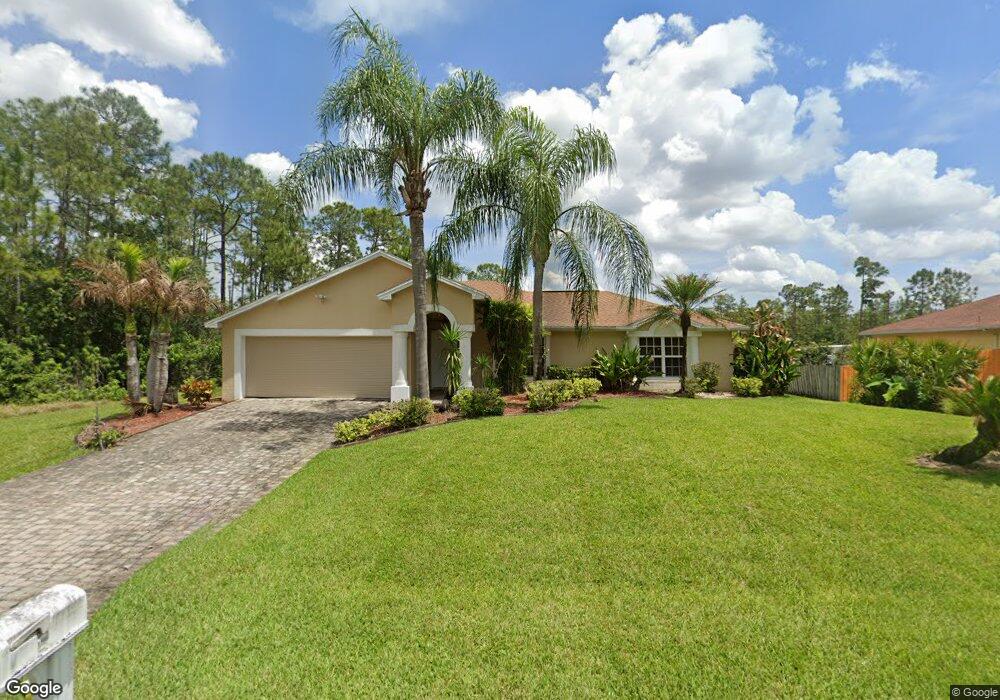
1320 8th Ave Unit 4 Lehigh Acres, FL 33972
Joel NeighborhoodEstimated Value: $318,000 - $444,000
3
Beds
2
Baths
1,674
Sq Ft
$223/Sq Ft
Est. Value
About This Home
This home is located at 1320 8th Ave Unit 4, Lehigh Acres, FL 33972 and is currently estimated at $372,826, approximately $222 per square foot. 1320 8th Ave Unit 4 is a home located in Lee County with nearby schools including Lehigh Elementary School, The Alva School, and Gateway Elementary School.
Ownership History
Date
Name
Owned For
Owner Type
Purchase Details
Closed on
Jul 31, 2012
Sold by
Mcf Enterprises Inc
Bought by
Selman Tom and Selman Juanita
Current Estimated Value
Purchase Details
Closed on
May 1, 2012
Sold by
Curbelo Pedro
Bought by
Mcf Enterprices Inc
Purchase Details
Closed on
Apr 29, 2006
Sold by
Nolen Dustin and Nolen Vicki
Bought by
Curbelo Pedro and Salina Olydia
Purchase Details
Closed on
Nov 30, 2001
Sold by
Corbett Julia A and Boyett Julia Ann
Bought by
Nolen Dustin and Nolen Vicki
Home Financials for this Owner
Home Financials are based on the most recent Mortgage that was taken out on this home.
Original Mortgage
$121,051
Interest Rate
6.49%
Purchase Details
Closed on
Nov 21, 1997
Sold by
Holiday Bldr Inc
Bought by
Voyet Julia Ann and Mullins Nancy E
Home Financials for this Owner
Home Financials are based on the most recent Mortgage that was taken out on this home.
Original Mortgage
$92,732
Interest Rate
7.38%
Mortgage Type
FHA
Create a Home Valuation Report for This Property
The Home Valuation Report is an in-depth analysis detailing your home's value as well as a comparison with similar homes in the area
Home Values in the Area
Average Home Value in this Area
Purchase History
| Date | Buyer | Sale Price | Title Company |
|---|---|---|---|
| Selman Tom | $144,000 | La Title Solutions Llc | |
| Mcf Enterprices Inc | $105,100 | None Available | |
| Curbelo Pedro | $307,500 | First Priority Title Llc | |
| Nolen Dustin | $127,500 | -- | |
| Voyet Julia Ann | $92,200 | -- |
Source: Public Records
Mortgage History
| Date | Status | Borrower | Loan Amount |
|---|---|---|---|
| Previous Owner | Nolen Dustin | $121,051 | |
| Previous Owner | Voyet Julia Ann | $92,732 |
Source: Public Records
Tax History Compared to Growth
Tax History
| Year | Tax Paid | Tax Assessment Tax Assessment Total Assessment is a certain percentage of the fair market value that is determined by local assessors to be the total taxable value of land and additions on the property. | Land | Improvement |
|---|---|---|---|---|
| 2025 | $4,310 | $295,595 | -- | -- |
| 2024 | $4,023 | $268,723 | -- | -- |
| 2023 | $4,023 | $244,294 | $0 | $0 |
| 2022 | $3,772 | $222,085 | $0 | $0 |
| 2021 | $3,183 | $202,894 | $6,500 | $196,394 |
| 2020 | $3,048 | $190,569 | $6,000 | $184,569 |
| 2019 | $2,904 | $182,499 | $5,500 | $176,999 |
| 2018 | $2,703 | $163,922 | $5,200 | $158,722 |
| 2017 | $2,616 | $161,486 | $4,410 | $157,076 |
| 2016 | $2,391 | $139,348 | $4,410 | $134,938 |
| 2015 | $2,160 | $117,514 | $4,120 | $113,394 |
| 2014 | $2,063 | $108,706 | $3,000 | $105,706 |
| 2013 | -- | $94,185 | $3,200 | $90,985 |
Source: Public Records
Map
Nearby Homes
- 601 E 14th St
- 1442 Lincoln Ave
- 1226 Lincoln Ave
- 503 E 13th St
- 124 Whitman Ct
- 2004 W 17th St
- 1420 Cleveland Ave
- 402 Thompson Ave
- 548 Lakeridge Blvd
- 301/303 12th St W
- 676 Sabrina Ct
- 1836 Jacinto Ave
- 2139 Viscount Ave
- 1917 Montero Ave
- 902 8th Ave
- 412 Lakeridge Blvd
- 2120 Oceano St
- 1921 Scott Ave
- 1842 Ottoman St
- 2106 Winnetka Dr
- 1318 8th Ave
- 1318 Eighth Ave
- 800 E 14th St
- 1319 Lake Ave
- 1601 Eighth Ave
- 907 Eighth Ave
- 909 Eighth Ave
- 1605 Eighth Ave
- 1323 8th Ave
- 806 E 14th St Unit 4
- 1319 8th Ave
- 1317 8th Ave
- 1403 Lake Ave
- 900 E 14th St
- 1403 18th Ave
- 1320 Lake Ave Unit 4
- 1318 Greenwood Ave
- 1310 8th Ave
- 700 E 14th St
- 701 E 14th St