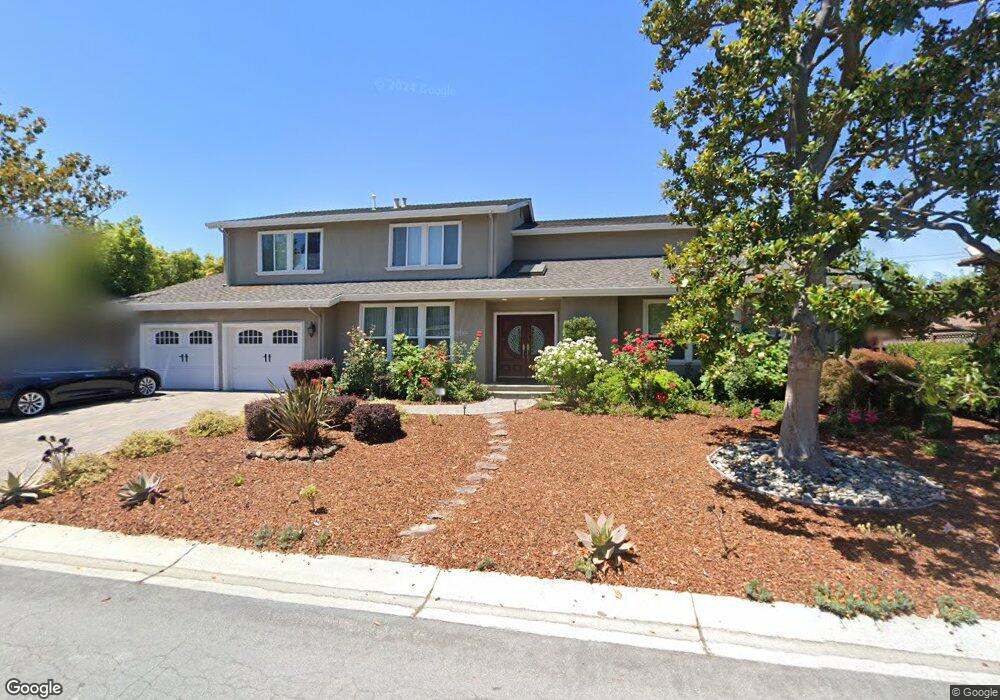
1320 Carvo Ct Los Altos, CA 94024
South Los Altos NeighborhoodEstimated Value: $4,697,000 - $6,267,000
5
Beds
4
Baths
4,149
Sq Ft
$1,330/Sq Ft
Est. Value
About This Home
This home is located at 1320 Carvo Ct, Los Altos, CA 94024 and is currently estimated at $5,516,647, approximately $1,329 per square foot. 1320 Carvo Ct is a home located in Santa Clara County with nearby schools including Oak Avenue Elementary School, Georgina P. Blach Junior High School, and Mountain View High School.
Ownership History
Date
Name
Owned For
Owner Type
Purchase Details
Closed on
May 4, 2010
Sold by
Lansky David and Lansky Marie
Bought by
Branstad Erik A and Branstad Audra Nicole
Current Estimated Value
Home Financials for this Owner
Home Financials are based on the most recent Mortgage that was taken out on this home.
Original Mortgage
$1,000,000
Outstanding Balance
$669,932
Interest Rate
5.04%
Mortgage Type
Purchase Money Mortgage
Estimated Equity
$4,846,715
Purchase Details
Closed on
Aug 15, 2005
Sold by
Meyers Jonathan and Meyers Joan M
Bought by
Lansky David and Lansky Marie
Home Financials for this Owner
Home Financials are based on the most recent Mortgage that was taken out on this home.
Original Mortgage
$242,500
Interest Rate
5.61%
Mortgage Type
Credit Line Revolving
Create a Home Valuation Report for This Property
The Home Valuation Report is an in-depth analysis detailing your home's value as well as a comparison with similar homes in the area
Home Values in the Area
Average Home Value in this Area
Purchase History
| Date | Buyer | Sale Price | Title Company |
|---|---|---|---|
| Branstad Erik A | $2,005,000 | Old Republic Title Company | |
| Lansky David | $2,050,000 | First American Title Company |
Source: Public Records
Mortgage History
| Date | Status | Borrower | Loan Amount |
|---|---|---|---|
| Open | Branstad Erik A | $1,000,000 | |
| Previous Owner | Lansky David | $242,500 | |
| Previous Owner | Lansky David | $1,500,000 |
Source: Public Records
Tax History Compared to Growth
Tax History
| Year | Tax Paid | Tax Assessment Tax Assessment Total Assessment is a certain percentage of the fair market value that is determined by local assessors to be the total taxable value of land and additions on the property. | Land | Improvement |
|---|---|---|---|---|
| 2025 | $30,358 | $2,588,086 | $1,290,817 | $1,297,269 |
| 2024 | $30,358 | $2,537,340 | $1,265,507 | $1,271,833 |
| 2023 | $29,916 | $2,487,590 | $1,240,694 | $1,246,896 |
| 2022 | $29,604 | $2,438,815 | $1,216,367 | $1,222,448 |
| 2021 | $29,754 | $2,390,996 | $1,192,517 | $1,198,479 |
| 2020 | $29,980 | $2,366,481 | $1,180,290 | $1,186,191 |
| 2019 | $28,544 | $2,320,081 | $1,157,148 | $1,162,933 |
| 2018 | $28,218 | $2,274,590 | $1,134,459 | $1,140,131 |
| 2017 | $27,125 | $2,229,991 | $1,112,215 | $1,117,776 |
| 2016 | $26,509 | $2,186,266 | $1,090,407 | $1,095,859 |
| 2015 | $26,075 | $2,153,428 | $1,074,029 | $1,079,399 |
| 2014 | $26,054 | $2,111,247 | $1,052,991 | $1,058,256 |
Source: Public Records
Map
Nearby Homes
- 1260 Grant Rd
- 1402 Oak Ave
- 1051 Suffolk Way
- 941 Berry Ave
- 1315 Bright Oaks Ct
- 3363 Grant Rd
- 980-B Lundy Ln
- 932 Lundy Ln
- 1686 Parkhills Ave
- 781 Covington Rd
- 1684 Newcastle Dr
- 1887 Walnut Dr
- 1405 Montclaire Place
- 1624 Clay Dr
- 767 Cuesta Dr
- 857 Hierra Ct
- 763 Cuesta Dr
- 766 Cuesta Dr
- 1631 Grant Rd
- 1992 Deodara Dr