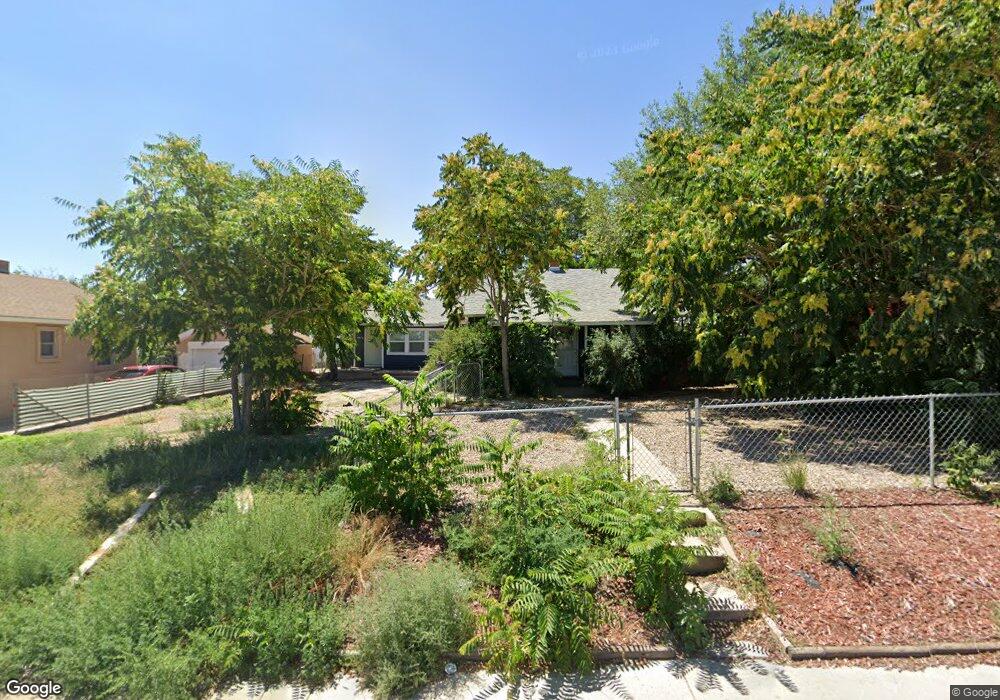
1320 E 4th St Pueblo, CO 81001
Lower East Side NeighborhoodEstimated Value: $221,598 - $267,000
4
Beds
2
Baths
2,492
Sq Ft
$99/Sq Ft
Est. Value
About This Home
This home is located at 1320 E 4th St, Pueblo, CO 81001 and is currently estimated at $246,199, approximately $98 per square foot. 1320 E 4th St is a home located in Pueblo County with nearby schools including Bradford Elementary School, Risley International Academy of Innovation, and East High School.
Ownership History
Date
Name
Owned For
Owner Type
Purchase Details
Closed on
Sep 14, 2022
Sold by
Property Purchase Partners Modernization
Bought by
Rabelo Sergio and Pinto Rebeca
Current Estimated Value
Home Financials for this Owner
Home Financials are based on the most recent Mortgage that was taken out on this home.
Original Mortgage
$244,000
Outstanding Balance
$234,445
Interest Rate
6%
Mortgage Type
New Conventional
Estimated Equity
$11,754
Purchase Details
Closed on
Apr 29, 2020
Sold by
Chapman Family Revocable Trust
Bought by
Property Purchase Partnersw Modernizatio
Purchase Details
Closed on
Apr 28, 2011
Sold by
Chapman Loretta J
Bought by
The Chapman Family Revocable Trust
Purchase Details
Closed on
Aug 25, 2006
Sold by
Chapman Darrel S
Bought by
Chapman Loretta J
Purchase Details
Closed on
Oct 23, 1992
Bought by
Chapman Darrel S
Purchase Details
Closed on
Sep 25, 1985
Sold by
Howrey +Betty Lee
Create a Home Valuation Report for This Property
The Home Valuation Report is an in-depth analysis detailing your home's value as well as a comparison with similar homes in the area
Home Values in the Area
Average Home Value in this Area
Purchase History
| Date | Buyer | Sale Price | Title Company |
|---|---|---|---|
| Rabelo Sergio | $254,000 | -- | |
| Property Purchase Partnersw Modernizatio | $61,143 | Land Title Guarantee Coa | |
| The Chapman Family Revocable Trust | -- | None Available | |
| Chapman Loretta J | $21,800 | None Available | |
| Chapman Darrel S | $17,500 | -- | |
| -- | -- | -- |
Source: Public Records
Mortgage History
| Date | Status | Borrower | Loan Amount |
|---|---|---|---|
| Open | Rabelo Sergio | $244,000 |
Source: Public Records
Tax History
| Year | Tax Paid | Tax Assessment Tax Assessment Total Assessment is a certain percentage of the fair market value that is determined by local assessors to be the total taxable value of land and additions on the property. | Land | Improvement |
|---|---|---|---|---|
| 2024 | $1,431 | $14,590 | -- | -- |
| 2023 | $1,447 | $18,280 | $1,010 | $17,270 |
| 2022 | $988 | $9,950 | $470 | $9,480 |
| 2021 | $1,019 | $10,230 | $480 | $9,750 |
| 2020 | $641 | $9,450 | $480 | $8,970 |
| 2019 | $641 | $6,346 | $358 | $5,988 |
| 2018 | $429 | $4,739 | $360 | $4,379 |
| 2017 | $434 | $4,739 | $360 | $4,379 |
| 2016 | $413 | $4,544 | $398 | $4,146 |
| 2015 | $206 | $4,544 | $398 | $4,146 |
| 2014 | $476 | $5,249 | $398 | $4,851 |
Source: Public Records
Map
Nearby Homes
- 1318 E 4th St
- 1328 E 4th St
- 1316 E 4th St
- 1330 E 4th St
- 1327 E 3rd St
- 1314 E 4th St
- 1319 E 3rd St
- 1329 E 3rd St
- 1315 E 3rd St
- 1333 E 3rd St
- 1334 E 4th St Unit 10
- 1313 E 3rd St
- 1327 E 4th St
- 1335 E 3rd St
- 1331 E 4th St
- 1336 E 4th St
- 1315 E 4th St Unit 1315, 1317
- 1308 E 4th St
- 1333 E 4th St
- 1309 E 3rd St
Your Personal Tour Guide
Ask me questions while you tour the home.